PROTECTED SOURCE SCRIPT
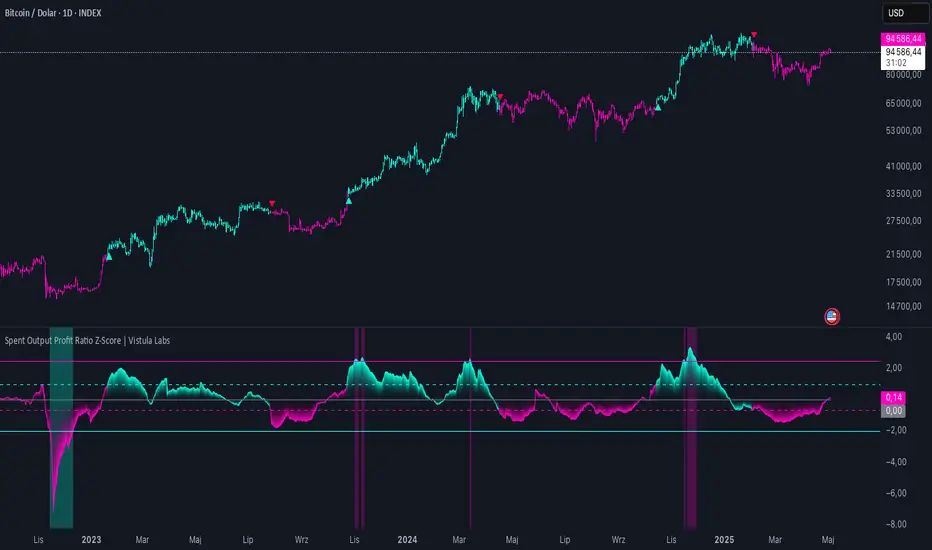
Spent Output Profit Ratio Z-Score | Vistula Labs
Overview
The Spent Output Profit Ratio (SOPR) Z-Score indicator is a sophisticated tool designed by Vistula Labs to help cryptocurrency traders analyze market sentiment and identify potential trend reversals. It leverages on-chain data from Glassnode to calculate the Spent Output Profit Ratio (SOPR) for Bitcoin and Ethereum, transforming this metric into a Z-Score for easy interpretation.
What is SOPR?
Spent Output Profit Ratio (SOPR) measures the profit ratio of spent outputs (transactions) on the blockchain:
SOPR provides insights into holder behavior—whether they are locking in profits or cutting losses—making it a valuable gauge of market sentiment.
How It Works
The indicator applies a Z-Score to the SOPR data to normalize it relative to its historical behavior:
Pine Script®
This Z-Score highlights how extreme the current SOPR is compared to its historical norm, helping traders spot significant deviations.
Key Features
Data Source:
Customization:
Signals:
Overbought/Oversold Conditions:
Visualizations:
Alerts:
Usage Guide
Interpretation
Conclusion
The SOPR Z-Score indicator combines on-chain data with statistical analysis to provide traders with a clear, actionable view of market sentiment. Its customizable settings, visual clarity, and alert system make it an essential tool for both novice and experienced traders seeking an edge in the cryptocurrency markets.
The Spent Output Profit Ratio (SOPR) Z-Score indicator is a sophisticated tool designed by Vistula Labs to help cryptocurrency traders analyze market sentiment and identify potential trend reversals. It leverages on-chain data from Glassnode to calculate the Spent Output Profit Ratio (SOPR) for Bitcoin and Ethereum, transforming this metric into a Z-Score for easy interpretation.
What is SOPR?
Spent Output Profit Ratio (SOPR) measures the profit ratio of spent outputs (transactions) on the blockchain:
- SOPR > 1: Indicates that, on average, coins are being sold at a profit.
- SOPR < 1: Suggests that coins are being sold at a loss.
- SOPR = 1: Break-even point, often seen as a key psychological level.
SOPR provides insights into holder behavior—whether they are locking in profits or cutting losses—making it a valuable gauge of market sentiment.
How It Works
The indicator applies a Z-Score to the SOPR data to normalize it relative to its historical behavior:
Z-Score = (Smoothed SOPR - Moving Average of Smoothed SOPR) / Standard Deviation of Smoothed SOPR
- Smoothed SOPR: A moving average (e.g., WMA) of SOPR over a short period (default: 30 bars) to reduce noise.
- Moving Average of Smoothed SOPR: A longer moving average (default: 180 bars) of the smoothed SOPR.
- Standard Deviation: Calculated over a lookback period (default: 200 bars).
This Z-Score highlights how extreme the current SOPR is compared to its historical norm, helping traders spot significant deviations.
Key Features
Data Source:
- Selectable between BTC and ETH, using daily SOPR data from Glassnode.
Customization:
- Moving Average Types: Choose from SMA, EMA, DEMA, RMA, WMA, or VWMA for both smoothing and main averages.
- Lengths: Adjust the smoothing period (default: 30) and main moving average length (default: 180).
- Z-Score Lookback: Default is 200 bars.
- Thresholds: Set levels for long/short signals and overbought/oversold conditions.
Signals:
- Long Signal: Triggered when Z-Score crosses above 1.02, suggesting potential upward momentum.
- Short Signal: Triggered when Z-Score crosses below -0.66, indicating potential downward momentum.
Overbought/Oversold Conditions:
- Overbought: Z-Score > 2.5, signaling potential overvaluation.
- Oversold: Z-Score < -2.0, indicating potential undervaluation.
Visualizations:
- Z-Score Plot: Teal for long signals, magenta for short signals.
- Threshold Lines: Dashed for long/short, solid for overbought/oversold.
- Candlestick Coloring: Matches signal colors.
- Arrows: Green up-triangles for long entries, red down-triangles for short entries.
- Background Colors: Magenta for overbought, teal for oversold.
Alerts:
- Conditions for Long Opportunity, Short Opportunity, Overbought, and Oversold.
Usage Guide
- Select Cryptocurrency: Choose BTC or ETH.
- Adjust Moving Averages: Customize types and lengths for smoothing and main averages.
- Set Thresholds: Define Z-Score levels for signals and extreme conditions.
- Monitor Signals: Use color changes, arrows, and background highlights to identify opportunities.
- Enable Alerts: Stay informed without constant chart watching.
Interpretation
- High Z-Score (>1.02): SOPR is significantly above its historical mean, potentially indicating overvaluation or strong bullish momentum.
- Low Z-Score (<-0.66): SOPR is below its mean, suggesting undervaluation or bearish momentum.
Extreme Conditions: Z-Scores above 2.5 or below -2.0 highlight overbought or oversold markets, often preceding reversals.
Conclusion
The SOPR Z-Score indicator combines on-chain data with statistical analysis to provide traders with a clear, actionable view of market sentiment. Its customizable settings, visual clarity, and alert system make it an essential tool for both novice and experienced traders seeking an edge in the cryptocurrency markets.
受保護腳本
此腳本以閉源形式發佈。 不過,您可以自由使用,沒有任何限制 — 點擊此處了解更多。
免責聲明
這些資訊和出版物並非旨在提供,也不構成TradingView提供或認可的任何形式的財務、投資、交易或其他類型的建議或推薦。請閱讀使用條款以了解更多資訊。
受保護腳本
此腳本以閉源形式發佈。 不過,您可以自由使用,沒有任何限制 — 點擊此處了解更多。
免責聲明
這些資訊和出版物並非旨在提供,也不構成TradingView提供或認可的任何形式的財務、投資、交易或其他類型的建議或推薦。請閱讀使用條款以了解更多資訊。