PROTECTED SOURCE SCRIPT
RSI EMA(RSI) WMA(RSI) (NK Hilega Milega)
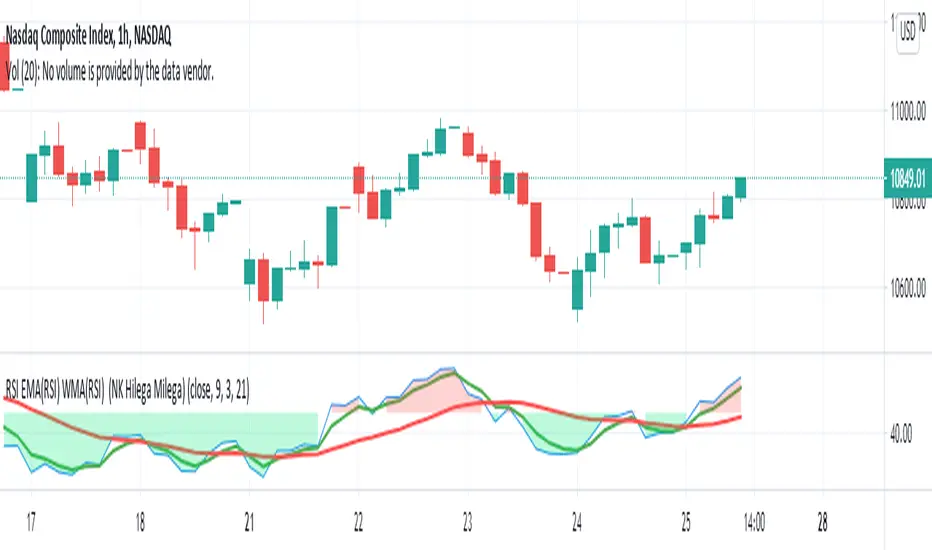
This indicator is works on RSI, Price and volume to give leading Indicator to Buy or Sell.
This indicator works on all financial markets
Hilega-Milega System.
For intraday trade, enter with 10 mins chart.
For positional trade, enter with 1-hour chart.
For Investment this system can be used with daily/weekly/monthly chart.
• RED line is for Volume.
• Green line is for the Price.
• Black line is for the RSI (9).
SELL Trade
1. When Volume (RED line) is above/crossed above Price (Green line) and Strength (Black line), then stock price will go down. This means we will SELL.
2. When there is a GAP in the RED line and the Green line till the time price will go down.
Exit criteria
Whenever Red line exit the shaded area of Oversold zone OR Red line cross over the Green and black line then we will exit.
In case of the SELL trade, after the entry we will monitor the trade in 5 min chart, if the candle is closed above the VWAP then exit.
If the price is crossed the 50 SMA then we will exit trade.
BUY Trade
1. When Volume (RED line) is below/crossed below Price (Green line) and Strength (Black line), then stock price will go up. This means we will BUY.
2. When there is a GAP in the RED line and the Green line till the time price will go down.
Exit criteria
Whenever Red line exit the shaded area of Overbought zone OR Red line cross over the Green and black line then we will exit.
In case of the Buy trade, after the entry we will monitor the trade candle is closed below the VWAP then exit.
If the price is crossed the 50 SMA then we will exit trade.
受保護腳本
此腳本以閉源形式發佈。 不過,您可以自由且不受任何限制地使用它 — 在此處了解更多資訊。
免責聲明
這些資訊和出版物並不意味著也不構成TradingView提供或認可的金融、投資、交易或其他類型的意見或建議。請在使用條款閱讀更多資訊。
受保護腳本
此腳本以閉源形式發佈。 不過,您可以自由且不受任何限制地使用它 — 在此處了解更多資訊。
免責聲明
這些資訊和出版物並不意味著也不構成TradingView提供或認可的金融、投資、交易或其他類型的意見或建議。請在使用條款閱讀更多資訊。