OPEN-SOURCE SCRIPT
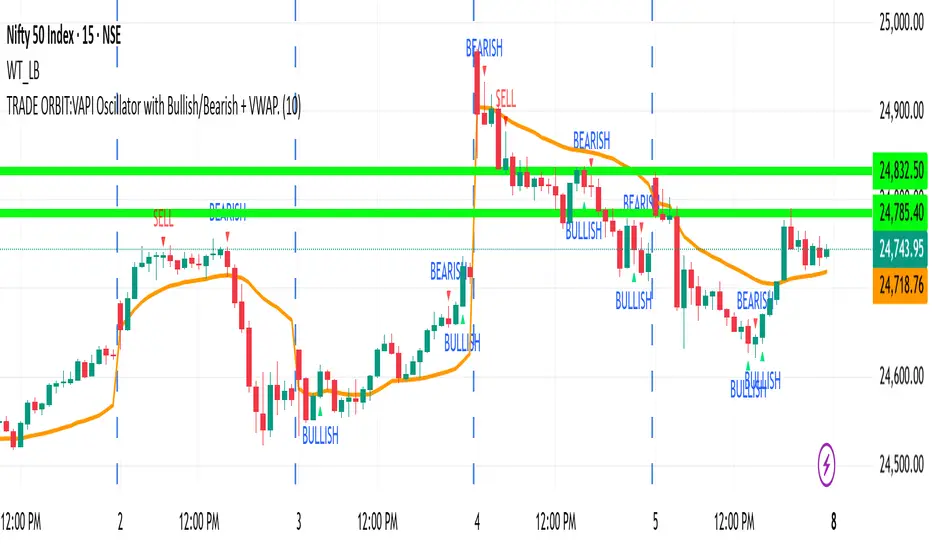
TRADE ORBIT:VAPI Oscillator with Bullish/Bearish + VWAP.
Components
VAPI Oscillator
Shows the balance of buying vs. selling pressure using price and volume.
Plotted as a histogram (green above zero, red below zero) with a gray oscillator line.
Zero line (gray) acts as the main threshold between bullish and bearish pressure.
Signals
Bullish Signal (▲ BULLISH) → Triggered when VAPI crosses above zero.
Bearish Signal (▼ BEARISH) → Triggered when VAPI crosses below zero.
Alerts are included for automation/notifications.
VWAP (Volume Weighted Average Price)
Plotted on the main price chart (orange line).
Resets each new trading day.
Acts as an institutional benchmark for trend and fair value.
🔹 How to Use
When VAPI crosses above zero → market pressure is bullish (look for long opportunities, especially if price is above VWAP).
When VAPI crosses below zero → market pressure is bearish (look for short opportunities, especially if price is below VWAP).
VWAP provides a strong support/resistance zone; confluence between VAPI and VWAP strengthens signals.
開源腳本
本著TradingView的真正精神,此腳本的創建者將其開源,以便交易者可以查看和驗證其功能。向作者致敬!雖然您可以免費使用它,但請記住,重新發佈程式碼必須遵守我們的網站規則。
免責聲明
這些資訊和出版物並不意味著也不構成TradingView提供或認可的金融、投資、交易或其他類型的意見或建議。請在使用條款閱讀更多資訊。
開源腳本
本著TradingView的真正精神,此腳本的創建者將其開源,以便交易者可以查看和驗證其功能。向作者致敬!雖然您可以免費使用它,但請記住,重新發佈程式碼必須遵守我們的網站規則。
免責聲明
這些資訊和出版物並不意味著也不構成TradingView提供或認可的金融、投資、交易或其他類型的意見或建議。請在使用條款閱讀更多資訊。