PROTECTED SOURCE SCRIPT
已更新 Multiple Indicator Connecting Dots
Hello All,
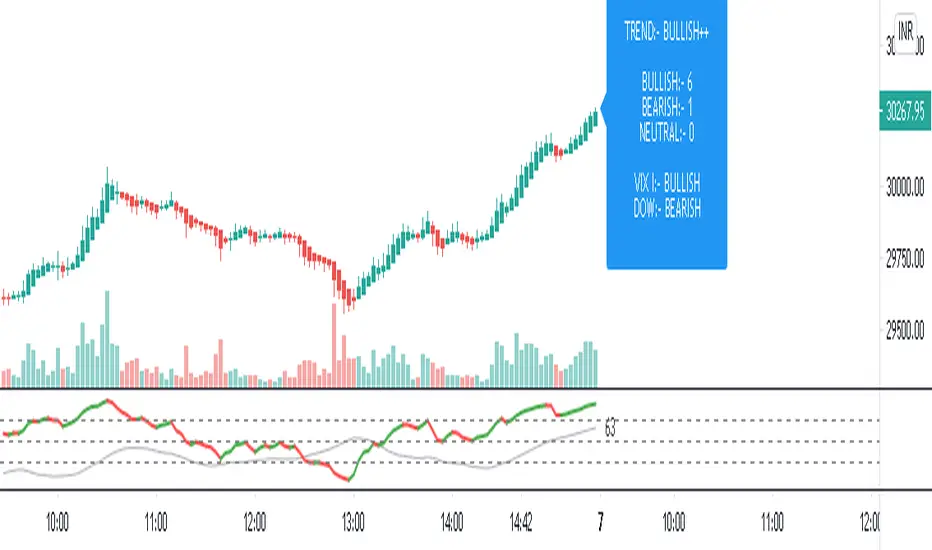
This script compares
1. Smoothed RSI
2. INDIA VIX
3. DOW
4. Price
5. Day Trend
6. Volume
And provides overall relative status of indicators.
Also play with different higher time-frames to get correct view on lower time-frames accordingly
P.S :- Please trade according to our setup, it just aids your view and only for educational purposes.
發行說明
Hello All,This script compares
1. Smoothed RSI
2. INDIA VIX
3. DOW
4. Price
5. Day Trend
6. Volume
And provides overall relative status of indicators.
Also play with different higher time-frames to get correct view on lower time-frames accordingly
P.S :- Please trade according to our setup, it just aids your view and only for educational purposes.
Update: Minor Changes
發行說明
Note:Script is only for BankNity and Banknifty futures, because it only considers Volume and VWAP of it.
Checkbox - Plot Trend History:- Its history of what current status of indicator is going on.
Green Arrow - Strong Bullish / Bullish
Lime Arrow - Weak Bullish
Red Arrow - Strong Bearish / Bearish
Orange Arrow - Weak Bearish
受保護腳本
此腳本以閉源形式發佈。 不過,您可以自由使用,沒有任何限制 — 點擊此處了解更多。
免責聲明
這些資訊和出版物並非旨在提供,也不構成TradingView提供或認可的任何形式的財務、投資、交易或其他類型的建議或推薦。請閱讀使用條款以了解更多資訊。
受保護腳本
此腳本以閉源形式發佈。 不過,您可以自由使用,沒有任何限制 — 點擊此處了解更多。
免責聲明
這些資訊和出版物並非旨在提供,也不構成TradingView提供或認可的任何形式的財務、投資、交易或其他類型的建議或推薦。請閱讀使用條款以了解更多資訊。