OPEN-SOURCE SCRIPT
Trading the Equity Curve Position Sizing Example
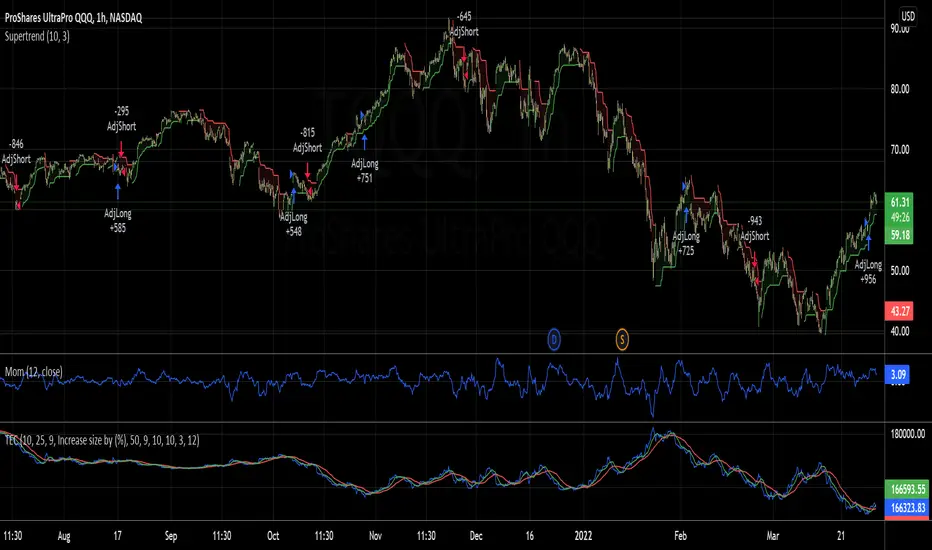
"Trading the equity curve" as a risk management method is the process of acting on trade signals depending on whether a system’s performance is indicating the strategy is in a profitable or losing phase.
The point of managing equity curve is to minimize risk in trading when the equity curve is in a downtrend. This strategy has two modes to determine the equity curve downtrend: By creating two simple moving averages of a portfolio's equity curve - a short-term and a longer-term one - and acting on their crossings. If the fast SMA is below the slow SMA, equity downtrend is detected (smafastequity < smaslowequity).
The second method is by using the crossings of equity itself with the longer-period SMA (equity < smasloweequity).
When Trading with the Equity Curve" is active, the position size will be reduced by a specified percentage if the equity is "under water" according to a selected rule. If you're a risk seeker, select "Increase size by %" - for some robust systems, it could help overcome their small drawdowns quicker.
開源腳本
本著TradingView的真正精神,此腳本的創建者將其開源,以便交易者可以查看和驗證其功能。向作者致敬!雖然您可以免費使用它,但請記住,重新發佈程式碼必須遵守我們的網站規則。
Need seasonals for futures data on NQ, ES, YM, or other commodities. Check out agresticresearch.com.
免責聲明
這些資訊和出版物並不意味著也不構成TradingView提供或認可的金融、投資、交易或其他類型的意見或建議。請在使用條款閱讀更多資訊。
開源腳本
本著TradingView的真正精神,此腳本的創建者將其開源,以便交易者可以查看和驗證其功能。向作者致敬!雖然您可以免費使用它,但請記住,重新發佈程式碼必須遵守我們的網站規則。
Need seasonals for futures data on NQ, ES, YM, or other commodities. Check out agresticresearch.com.
免責聲明
這些資訊和出版物並不意味著也不構成TradingView提供或認可的金融、投資、交易或其他類型的意見或建議。請在使用條款閱讀更多資訊。