OPEN-SOURCE SCRIPT
MACD divergence with line drawing by Rexio
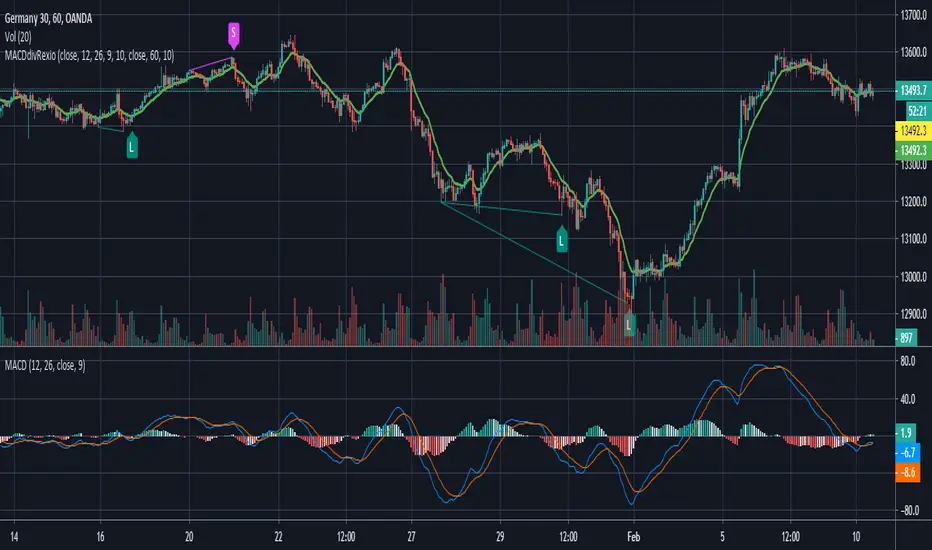
Another appoach to finding divergences at MACD. This time I think it is much smoother so I could check for divergences between two "peaks" at MACD.
I added my SL line which is last peak +- 1xATR. And the second line is peak between two points of divergence and most of the time it acts like an SR line.
If the higher timeframe trend backs up our divergence (for example: higher trend UP - divergence for L position) I can try to jump in after crossing EMA10.
This indicator is only sugestion for me. I always check price action, trend, SR line before I take any action.
Every people who will test this indicator need to know basics about divergences as THISE ARE NOT BUY/SELL SIGNALS.
If you want to help me and support my coding please contact me via private msg.
開源腳本
本著TradingView的真正精神,此腳本的創建者將其開源,以便交易者可以查看和驗證其功能。向作者致敬!雖然您可以免費使用它,但請記住,重新發佈程式碼必須遵守我們的網站規則。
免責聲明
這些資訊和出版物並不意味著也不構成TradingView提供或認可的金融、投資、交易或其他類型的意見或建議。請在使用條款閱讀更多資訊。
免責聲明
這些資訊和出版物並不意味著也不構成TradingView提供或認可的金融、投資、交易或其他類型的意見或建議。請在使用條款閱讀更多資訊。