OPEN-SOURCE SCRIPT
MACD MultiTimeFrame 1h4h1D [Fantastic Fox]
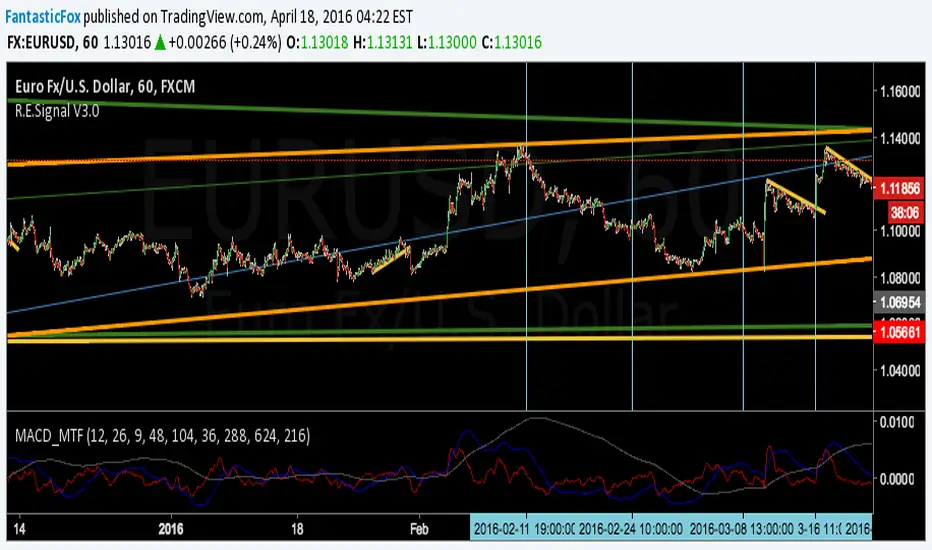
Please insert the indicator into 1h time-frame, otherwise you need to change the lengths' inputs.
When there are tops for two of the MACDs and they are near and close* to each other, there is a big opportunity of a "Major Top" for the security, and vice versa for "Major Bottom".
This indicator can be used for tracing multi time-frame divergence. Also, it could help traders to identify the waves of Elliott Wave, and as a signal for confirmation of an impulse after a correction or retracement.
* They should be on top of each others head, not crossing each other. not necessarily touching, but not so far from each other.
開源腳本
本著TradingView的真正精神,此腳本的創建者將其開源,以便交易者可以查看和驗證其功能。向作者致敬!雖然您可以免費使用它,但請記住,重新發佈程式碼必須遵守我們的網站規則。
免責聲明
這些資訊和出版物並不意味著也不構成TradingView提供或認可的金融、投資、交易或其他類型的意見或建議。請在使用條款閱讀更多資訊。
開源腳本
本著TradingView的真正精神,此腳本的創建者將其開源,以便交易者可以查看和驗證其功能。向作者致敬!雖然您可以免費使用它,但請記住,重新發佈程式碼必須遵守我們的網站規則。
免責聲明
這些資訊和出版物並不意味著也不構成TradingView提供或認可的金融、投資、交易或其他類型的意見或建議。請在使用條款閱讀更多資訊。