OPEN-SOURCE SCRIPT
Ehlers Hilbert Transform [CC]
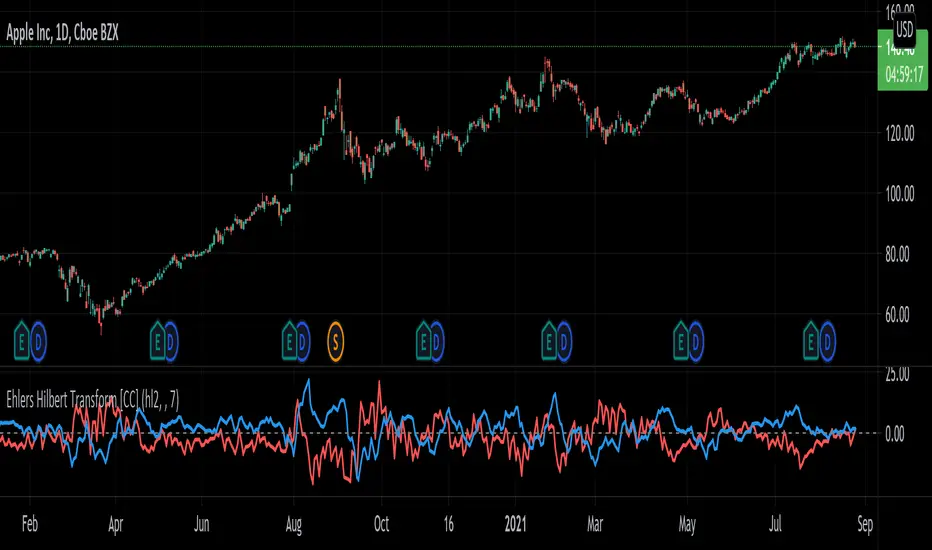
The Hilbert Transform was created by John Ehlers (Stocks & Commodities V. 18:3 (16-27)) and this indicator can work pretty well as a trend confirmation. This essentially transforms the underlying price data into a soundwave and when you compare the two (blue is positive and red is negative) then it provides fairly clear buy and sell signals. Ehlers did warn in his original article that this indicator has a lag of 4 bars so you have to keep that in mind. I have found that this indicator works pretty well when you buy when the blue line goes over the red line and sell when the blue lines hits the zero line. You could also ignore the red line and buy when the blue line crosses over the zero line and sell when it crosses under. Let me know how you wind up using this indicator in your trading.
Let me know if there are any other scripts you would like to see me publish!
Let me know if there are any other scripts you would like to see me publish!
開源腳本
本著TradingView的真正精神,此腳本的創建者將其開源,以便交易者可以查看和驗證其功能。向作者致敬!雖然您可以免費使用它,但請記住,重新發佈程式碼必須遵守我們的網站規則。
I created the largest stock indicator library:
github.com/ooples/
Custom Indicator Requests:
forms.gle/ouMffZR3dQ8bSJQG7
Tips are appreciated:
paypal.me/cheatcountry
patreon.com/cheatcountry
github.com/ooples/
Custom Indicator Requests:
forms.gle/ouMffZR3dQ8bSJQG7
Tips are appreciated:
paypal.me/cheatcountry
patreon.com/cheatcountry
免責聲明
這些資訊和出版物並不意味著也不構成TradingView提供或認可的金融、投資、交易或其他類型的意見或建議。請在使用條款閱讀更多資訊。