INVITE-ONLY SCRIPT
已更新 DMH‴ | Directional Movement Histogram‴
What does it do?
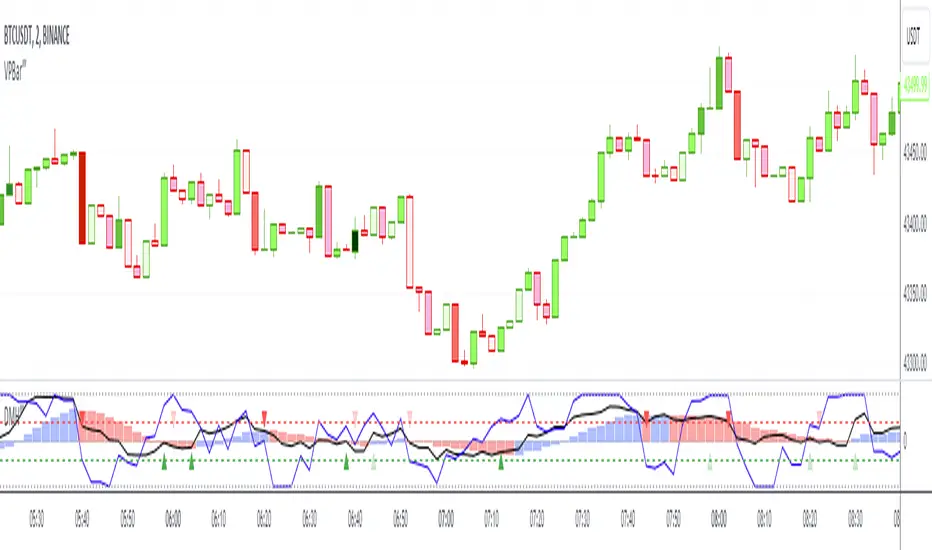
Converts all DMI lines into one line and represents the line behaviour in a histogram format, which provides more understanding of this indicator movement.
How does it work?
The better sell signal is given when the line crosses under the zero line (providing the 3of3 signal), but an antecipation of the selling opportunity is given when the line crosses under the top of its closest histrogram bar (providing the 1of3 signal). And vice-verse for the by signal.
When the line goes under the oversold zone, it won't take to long to move out of that zone providing us with the 2of3 signal), and vice-verse for the overbought zone.
You won't provided with all 3 signals at all time, once it depends on the line move, but the more signs you get, the earlier you can keep your eyes on a potential opportunity.
What's my filling?
Gives you a quick perception of the direction of the price move. When all indicators are showing the same direction and the DMH shows the other direction, I'd wait to see the DMH joining all other indicators. Until that happens, the price seams to get stuck.
Indicator features:
- red arrow above the histogram provides the line crossing under the top of its closest histogram bar, and a green arrow under the histogram provides the line crossing above the negative top of iths closest histogram bar
- Trend Color Bar: let the candlesticks show you the trend and its reversal
- Momentum Power: besides to the above features, you can add a momentum power indicator with arrow and/or moving average lines crossing
To have access to this indicator, please DM me.
Don't contact me in the comment area.
發行說明
This release includes a new line called "Reversal Line" that helps us spot potential price reversal.發行說明
Update just to fix chart image that was previously uploaded incorrectly.發行說明
Minor menu cleanup.發行說明
Color adjustment.僅限邀請腳本
僅作者批准的使用者才能訪問此腳本。您需要申請並獲得使用許可,通常需在付款後才能取得。更多詳情,請依照作者以下的指示操作,或直接聯絡MarceloTorres。
TradingView不建議在未完全信任作者並了解其運作方式的情況下購買或使用腳本。您也可以在我們的社群腳本中找到免費的開源替代方案。
作者的說明
To have access to this indicator, please DM me.
Don't contact me in the comment area.
TRADEWISER | Marcelo Torres
marcelo@tradewiser.pro
Vídeo-Análise completa diária no YouTube:
youtube.com/c/TradeWiserPro
Curso/AE
CursoAE.TradeWiser.pro
@TradeWiserPro
Telegram, Twitter, Facebook, LinkedIn, Instagram
marcelo@tradewiser.pro
Vídeo-Análise completa diária no YouTube:
youtube.com/c/TradeWiserPro
Curso/AE
CursoAE.TradeWiser.pro
@TradeWiserPro
Telegram, Twitter, Facebook, LinkedIn, Instagram
免責聲明
這些資訊和出版物並非旨在提供,也不構成TradingView提供或認可的任何形式的財務、投資、交易或其他類型的建議或推薦。請閱讀使用條款以了解更多資訊。
僅限邀請腳本
僅作者批准的使用者才能訪問此腳本。您需要申請並獲得使用許可,通常需在付款後才能取得。更多詳情,請依照作者以下的指示操作,或直接聯絡MarceloTorres。
TradingView不建議在未完全信任作者並了解其運作方式的情況下購買或使用腳本。您也可以在我們的社群腳本中找到免費的開源替代方案。
作者的說明
To have access to this indicator, please DM me.
Don't contact me in the comment area.
TRADEWISER | Marcelo Torres
marcelo@tradewiser.pro
Vídeo-Análise completa diária no YouTube:
youtube.com/c/TradeWiserPro
Curso/AE
CursoAE.TradeWiser.pro
@TradeWiserPro
Telegram, Twitter, Facebook, LinkedIn, Instagram
marcelo@tradewiser.pro
Vídeo-Análise completa diária no YouTube:
youtube.com/c/TradeWiserPro
Curso/AE
CursoAE.TradeWiser.pro
@TradeWiserPro
Telegram, Twitter, Facebook, LinkedIn, Instagram
免責聲明
這些資訊和出版物並非旨在提供,也不構成TradingView提供或認可的任何形式的財務、投資、交易或其他類型的建議或推薦。請閱讀使用條款以了解更多資訊。