OPEN-SOURCE SCRIPT
Visualizing Displacement [TFO]
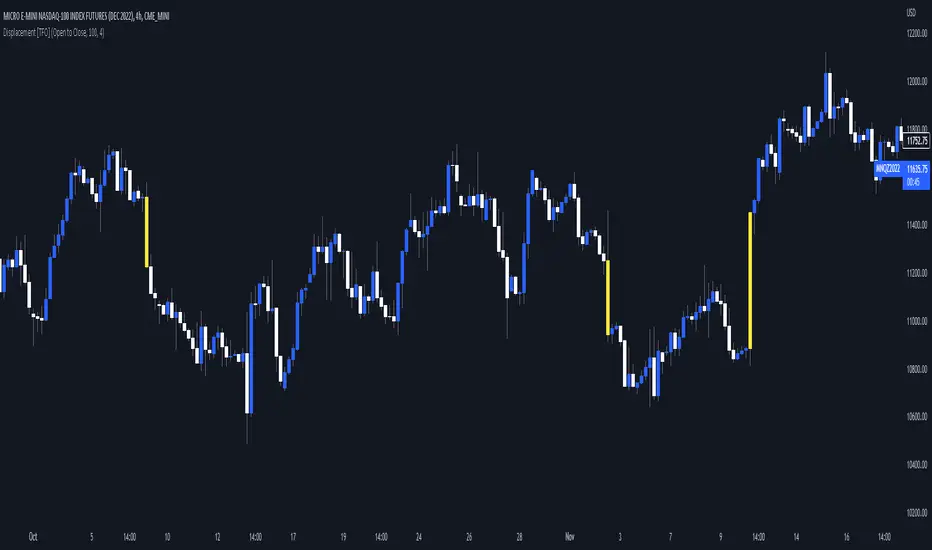
An easy and basic way to visualize displacement (energetic moves) in single bars/candles. This is determined by comparing the bar range (either from high to low, or from open to close) to its standard deviation over some specified length. The strength parameter applies some multiple to the standard deviation, which can help to filter out only the strongest indications of potential displacement.
Displacement is a key concept in Inner Circle Trader (ICT) concepts, especially when anticipating potential changes in trend. Although it's fairly easy to see "displacement candles" with large ranges, the bar coloring in this script can help remind us of who is in control (buyers or sellers) based on what side is creating those energetic moves most recently. Once we see signs of displacement, we can then apply concepts like premium/discount, order blocks, optimal trade entries, etc. to look for reasonable trade opportunities in the direction of the current trend.
A lack of displacement can be just as telling - if an effort to displace through a key swing high/low has failed, it's possible that a reversal may be underway.
開源腳本
本著TradingView的真正精神,此腳本的創建者將其開源,以便交易者可以查看和驗證其功能。向作者致敬!雖然您可以免費使用它,但請記住,重新發佈程式碼必須遵守我們的網站規則。
免責聲明
這些資訊和出版物並不意味著也不構成TradingView提供或認可的金融、投資、交易或其他類型的意見或建議。請在使用條款閱讀更多資訊。
開源腳本
本著TradingView的真正精神,此腳本的創建者將其開源,以便交易者可以查看和驗證其功能。向作者致敬!雖然您可以免費使用它,但請記住,重新發佈程式碼必須遵守我們的網站規則。
免責聲明
這些資訊和出版物並不意味著也不構成TradingView提供或認可的金融、投資、交易或其他類型的意見或建議。請在使用條款閱讀更多資訊。