OPEN-SOURCE SCRIPT
Calvin Moving Averages
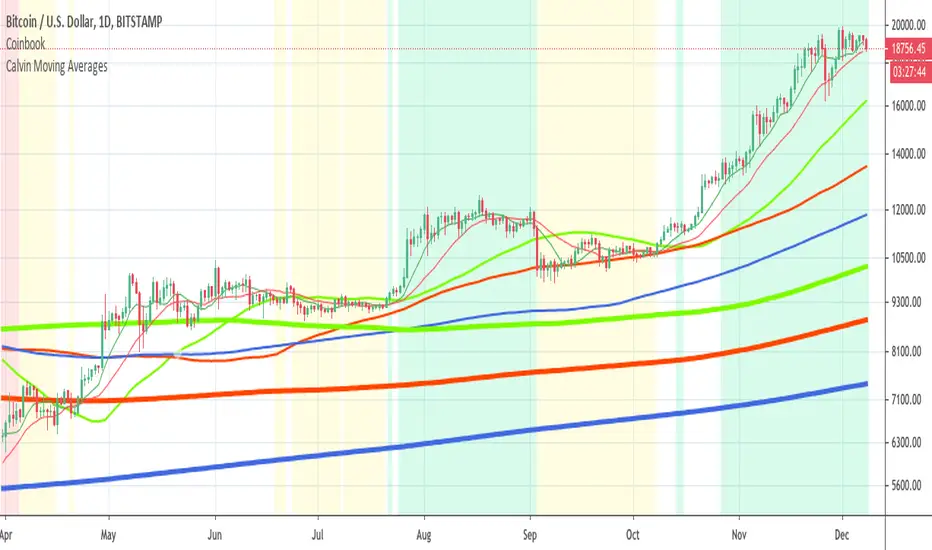
This is Coinbook's major indicator complete with red, yellow, and green zones. The major moving averages are also displayed.
The red zone is where the close is less than the 50 day sma, which is less than the 100 day sma, which is less than the 200 day sma. The slope of the 50 & 100 day smas are sloping down. The green zone is the exact opposite where the close is greater than the 50 day sma, which is greater than the 100 day sma, which is greater than the 200 day sma. The slope of the 50 & 100 in this case are both sloping upward. We get into a yellow zone when we are below the 50 and when we are not in a green or yellow zone. The white zone is everything else.
The main idea is that when we exit the red zone, generally that is a very good place to enter a trade. When we exit the green zone we usually want to sell. There are many nuances and exceptions which are explained during the conversations at the Coinbook YouTube channel: youtube.com/channel/UCKk80C6quLfQMBHvN0cX5Rg
Best of luck in your trading!
If this indicator helps you or you are just feeling generous please send a donation. Thanks! You guys are awesome :)
BTC: 35LxBrVYq2t2m3dNmB3nRhhW25yydwUqH9
LTC: MFD7rE5AYCUh521Wwg9vcNoFUihFpQWPhB
DGB: Sk7zjXdZd7nWWcnnrcGwVcWREL8daBE7eC
ETH: 0x412B6152cd05B331D45e22C5A4a5b2aa6396d8Cb
BCH: qpnypx6u333tkzyk4fy99c2fhhtedpje5cslamzw4c
DOGE: DGHHTSVHLfd1jQgtqYkmLDh8CYQZhrpnrE
開源腳本
本著TradingView的真正精神,此腳本的創建者將其開源,以便交易者可以查看和驗證其功能。向作者致敬!雖然您可以免費使用它,但請記住,重新發佈程式碼必須遵守我們的網站規則。
免責聲明
這些資訊和出版物並不意味著也不構成TradingView提供或認可的金融、投資、交易或其他類型的意見或建議。請在使用條款閱讀更多資訊。
開源腳本
本著TradingView的真正精神,此腳本的創建者將其開源,以便交易者可以查看和驗證其功能。向作者致敬!雖然您可以免費使用它,但請記住,重新發佈程式碼必須遵守我們的網站規則。
免責聲明
這些資訊和出版物並不意味著也不構成TradingView提供或認可的金融、投資、交易或其他類型的意見或建議。請在使用條款閱讀更多資訊。