OPEN-SOURCE SCRIPT
Time-Based Market Structure (Levels 00 / 03 / 29)
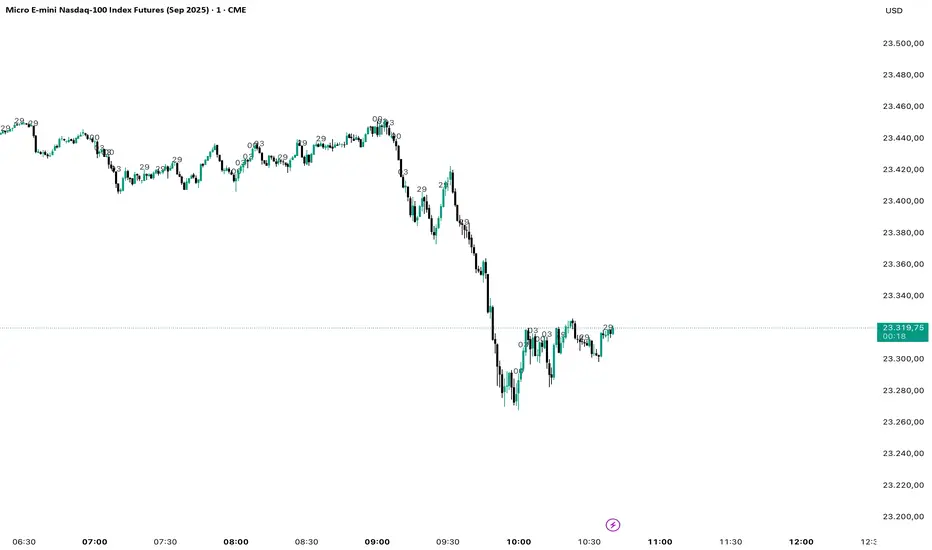
This indicator plots three recurring time-based anchors on the chart: 00, 03, and 29.
These anchors can help traders observe how price tends to react around specific temporal points during the day or month.
Main features:
• Enable/disable each level individually (00, 03, 29)
• Customize label colors
• Direct visualization on the chart with labels placed above candles
Practical use:
The tool is useful for traders studying market structure in both intraday and multi-timeframe contexts, looking for recurring temporal patterns that may coincide with areas of volatility or potential directional shifts.
Important note:
This indicator does not provide buy or sell signals. It is intended as a visual aid for discretionary analysis and as a study tool for exploring how time-based conditions may influence price behavior.
開源腳本
本著TradingView的真正精神,此腳本的創建者將其開源,以便交易者可以查看和驗證其功能。向作者致敬!雖然您可以免費使用它,但請記住,重新發佈程式碼必須遵守我們的網站規則。
免責聲明
這些資訊和出版物並不意味著也不構成TradingView提供或認可的金融、投資、交易或其他類型的意見或建議。請在使用條款閱讀更多資訊。
開源腳本
本著TradingView的真正精神,此腳本的創建者將其開源,以便交易者可以查看和驗證其功能。向作者致敬!雖然您可以免費使用它,但請記住,重新發佈程式碼必須遵守我們的網站規則。
免責聲明
這些資訊和出版物並不意味著也不構成TradingView提供或認可的金融、投資、交易或其他類型的意見或建議。請在使用條款閱讀更多資訊。