OPEN-SOURCE SCRIPT
Moving averages and bands
I coded this simple indicator based on multiple ideas shared by Tim West at his "Key Hidden Levels" chatroom.
The idea is to have multiple reasons to stay in a trade, which is normally very hard to do, specially when winning.
Cheers,
Ivan Labrie
Time at Mode FX
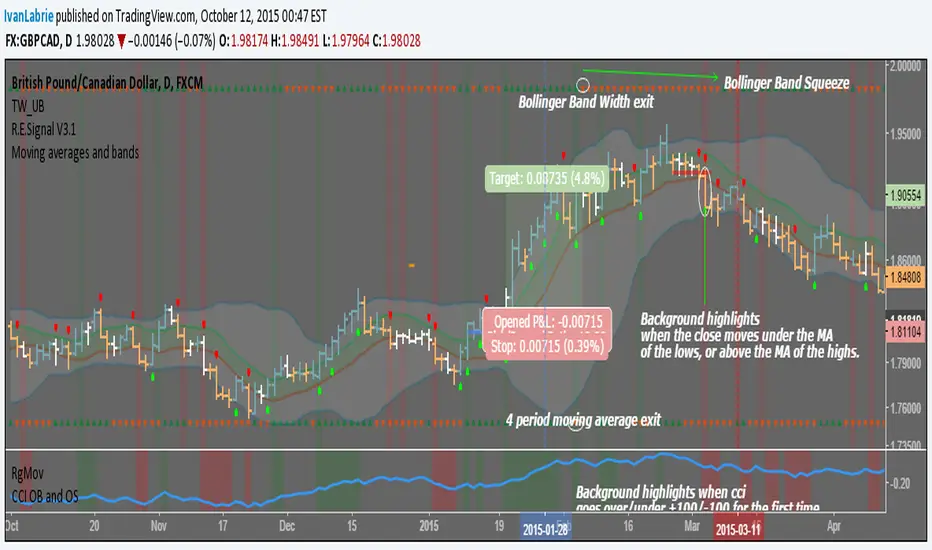
- We have a moving average ribbon comprised of the average of the highs and lows in 10 periods. The colored space in between acts more or less like fair value and is often where price is when consolidating.
- Green and red triangles at the top and bottom of the screen.
The ones at the bottom, correspond to signals obtained from a 4 period moving average of the close's slope. It helps get excellent exits for trending moves by changing color with the moving average slope.
The ones at the top, are green while Bollinger Band Width increases, and red while it decreases, relative to the previous bar. - Background color highlights when the close moves over the moving average of the highs or under the moving average of the lows, indicating a change of trend is possible, or at least a pause/consolidation.
The idea is to have multiple reasons to stay in a trade, which is normally very hard to do, specially when winning.
Cheers,
Ivan Labrie
Time at Mode FX
開源腳本
本著TradingView的真正精神,此腳本的創建者將其開源,以便交易者可以查看和驗證其功能。向作者致敬!雖然您可以免費使用它,但請記住,重新發佈程式碼必須遵守我們的網站規則。
🔒Want to dive deeper? Check out my paid services below🔒
linktr.ee/ivanlabrie
linktr.ee/ivanlabrie
免責聲明
這些資訊和出版物並不意味著也不構成TradingView提供或認可的金融、投資、交易或其他類型的意見或建議。請在使用條款閱讀更多資訊。
開源腳本
本著TradingView的真正精神,此腳本的創建者將其開源,以便交易者可以查看和驗證其功能。向作者致敬!雖然您可以免費使用它,但請記住,重新發佈程式碼必須遵守我們的網站規則。
🔒Want to dive deeper? Check out my paid services below🔒
linktr.ee/ivanlabrie
linktr.ee/ivanlabrie
免責聲明
這些資訊和出版物並不意味著也不構成TradingView提供或認可的金融、投資、交易或其他類型的意見或建議。請在使用條款閱讀更多資訊。