OPEN-SOURCE SCRIPT
Lunar Sentiment Bands
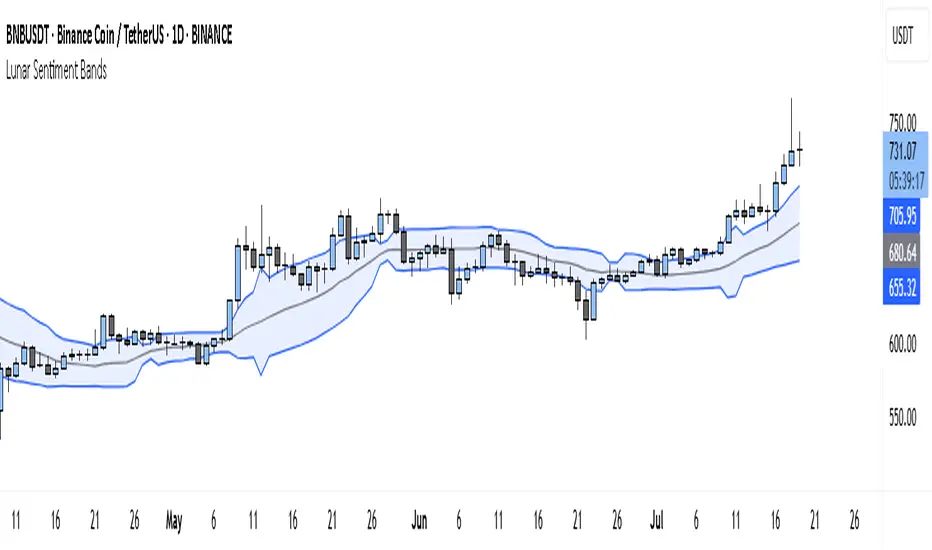
The Lunar Sentiment Bands indicator is designed to combine simple price volatility analysis with the timing of moon phases. It's based on a moving average and two bands above and below it—similar to Bollinger Bands. But unlike regular bands, the width of these adjusts dynamically depending on two key conditions: the moon phase and market volume.
Around Full Moons, markets often show emotional or volatile behavior. If there's also a surge in trading volume during that time, the indicator automatically expands the bands. This tells you the market might be gearing up for a breakout or high-energy move.
Around New Moons, things are typically quieter. If there’s no significant volume, the indicator contracts the bands. This reflects a calmer environment or a potential “coil” where price is building up energy.
Traders can use this shifting bandwidth to guide decisions. Wide bands suggest breakout potential—either to join the move or to stand back until direction becomes clearer. Narrow bands suggest you may want to trade reversals, or simply wait for volatility to return before entering a position.
This approach doesn't try to predict direction. Instead, it gives you a sense of when the market is most likely to become active or stay quiet, using the rhythm of the moon and real-time volume to shape that view.
開源腳本
秉持TradingView一貫精神,這個腳本的創作者將其設為開源,以便交易者檢視並驗證其功能。向作者致敬!您可以免費使用此腳本,但請注意,重新發佈代碼需遵守我們的社群規範。
Trade forex, indices, stocks and metals with up to US$100.000 in company's funding.
Complete a challenge to access funding or go for instant deposit.
Trading involves substantial risk. Not financial advice
Complete a challenge to access funding or go for instant deposit.
Trading involves substantial risk. Not financial advice
免責聲明
這些資訊和出版物並非旨在提供,也不構成TradingView提供或認可的任何形式的財務、投資、交易或其他類型的建議或推薦。請閱讀使用條款以了解更多資訊。