PROTECTED SOURCE SCRIPT
IB Breakout
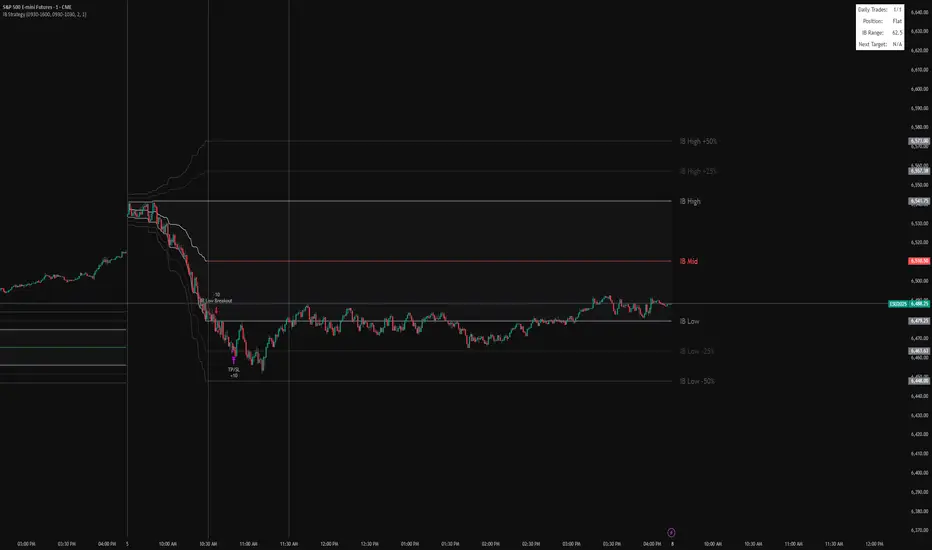
It marks the IB range (high, low, midpoint) from a chosen session window (default 9:30–10:30).
It plots the IB lines, midpoint (colored based on close), and extension levels (+/–25% and 50%).
After the IB session ends, it looks for breakouts:
Long if price closes above IB high.
Short if price closes below IB low.
Each trade targets the 25% extension in the breakout direction, with an optional stop at the opposite IB level.
It limits the number of trades per day and displays info (trades, position, IB range, next target) in a table.
受保護腳本
此腳本以閉源形式發佈。 不過,您可以自由使用,沒有任何限制 — 點擊此處了解更多。
免責聲明
這些資訊和出版物並非旨在提供,也不構成TradingView提供或認可的任何形式的財務、投資、交易或其他類型的建議或推薦。請閱讀使用條款以了解更多資訊。
免責聲明
這些資訊和出版物並非旨在提供,也不構成TradingView提供或認可的任何形式的財務、投資、交易或其他類型的建議或推薦。請閱讀使用條款以了解更多資訊。