INVITE-ONLY SCRIPT
已更新 AIChannel Strategy
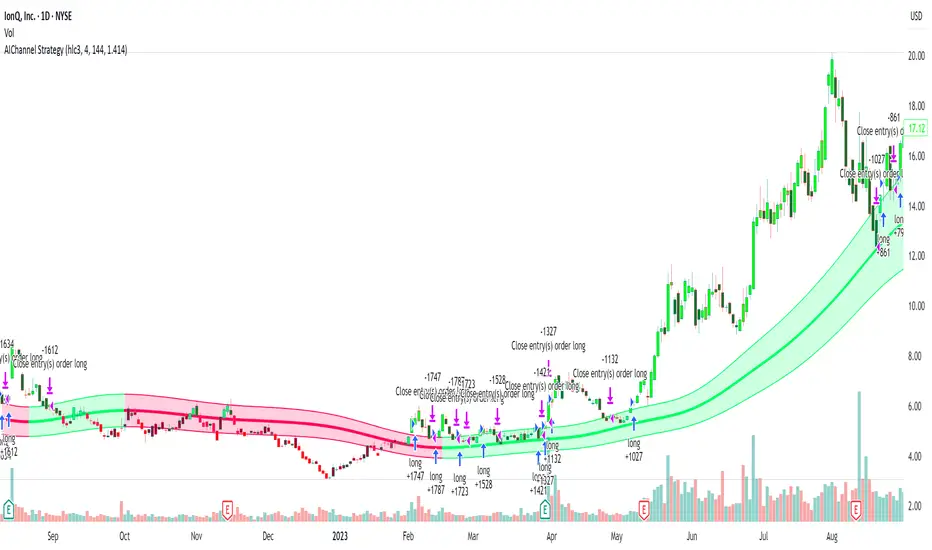
AIChannel Strategy is a long-only breakout system that trades when price closes above a dynamic upper band derived from a Gaussian-style filter. The channel width adapts to volatility using True Range, so signals naturally thin out during quiet markets and expand during trends.
How it works (under the hood)
Builds a Gaussian-like smoothing filter by cascading EMAs (AIFilter) using a tunable number of poles.
Optionally applies lag reduction (simple look-ahead compensation) and a Fast Response mode (averages with a 1-pole version).
Computes upper/lower bands:
upper = filter + (filter of True Range) × multiplier
lower = filter − (filter of True Range) × multiplier
Entry: when close crosses above the upper band and the bar time is within the selected date range.
Exit: when close crosses back below the upper band.
Includes an equity-line plot and optional (commented) CAGR / Max-DD ratio calculation for quick performance diagnostics.
Inputs (quick guide)
Source (src) – default hlc3.
Poles (1–9) – more poles → smoother, slower filter. Default 4.
Period – base smoothing length (default 144).
Range Multiplier – scales band width (default 1.414).
Reduced Lag – simple lag compensation toggle.
Fast Response – blends in a 1-pole filter for snappier turns.
Start/End Date – trades only inside this window (default 2018-01-01 → 2069-01-01).
Default backtest settings (in code)
1D timeframe (recommended for BTCUSD).
100% of equity per trade (strategy.percent_of_equity = 100).
Commission 0.1%, 1 tick slippage.
No shorts, no pyramiding beyond one position.
Best use
Designed for trend-following on assets with powerful expansions (e.g., BTCUSD 1D).
If your market is choppy, consider increasing Period and/or Range Multiplier, or enabling Fast Response off (for fewer signals).
Notes & Limitations
Exits are only by crossunder of the upper band; there is no explicit stop-loss or take-profit in this base version.
The CAGR/Max-DD lines are computed but plots are commented out—uncomment if you want to visualize them.
As with all backtests, results depend on exchange feed, session, commissions, and slippage.
Disclaimers
This script is for research/education. It is not financial advice. Always validate on your own data and risk parameters before live use.
Keywords / Tags
Trend, Breakout, Gaussian, EMA, Volatility, True Range, BTCUSD, Long-Only, Daily, Systematic
發行說明
AIChannel Strategy is a long-only breakout system that trades when price closes above a dynamic upper band derived from a Gaussian-style filter. The channel width adapts to volatility using True Range, so signals naturally thin out during quiet markets and expand during trends.How it works (under the hood)
Builds a Gaussian-like smoothing filter by cascading EMAs (AIFilter) using a tunable number of poles.
Optionally applies lag reduction (simple look-ahead compensation) and a Fast Response mode (averages with a 1-pole version).
Computes upper/lower bands:
upper = filter + (filter of True Range) × multiplier
lower = filter − (filter of True Range) × multiplier
Entry: when close crosses above the upper band and the bar time is within the selected date range.
Exit: when close crosses back below the upper band.
Inputs (quick guide)
Source (src) – default hlc3.
Poles (1–9) – more poles → smoother, slower filter. Default 4.
Period – base smoothing length (default 144).
Range Multiplier – scales band width (default 1.414).
Reduced Lag – simple lag compensation toggle.
Fast Response – blends in a 1-pole filter for snappier turns.
Default backtest settings (in code)
100% of equity per trade (strategy.percent_of_equity = 100).
Commission 0.1%, 1 tick slippage.
No shorts, no pyramiding beyond one position.
Best use
Designed for trend-following on assets with powerful expansions (e.g., BTCUSD 1D).
If your market is choppy, consider increasing Period and/or Range Multiplier, or enabling Fast Response off (for fewer signals).
Notes & Limitations
Exits are only by crossunder of the upper band; there is no explicit stop-loss or take-profit in this base version.
The CAGR/Max-DD lines are computed but plots are commented out—uncomment if you want to visualize them.
As with all backtests, results depend on exchange feed, session, commissions, and slippage.
Disclaimers
This script is for research/education. It is not financial advice. Always validate on your own data and risk parameters before live use.
免責聲明
這些資訊和出版物並非旨在提供,也不構成TradingView提供或認可的任何形式的財務、投資、交易或其他類型的建議或推薦。請閱讀使用條款以了解更多資訊。