INVITE-ONLY SCRIPT
已更新 Ethereum: Confidence Bands
Purpose of this Script
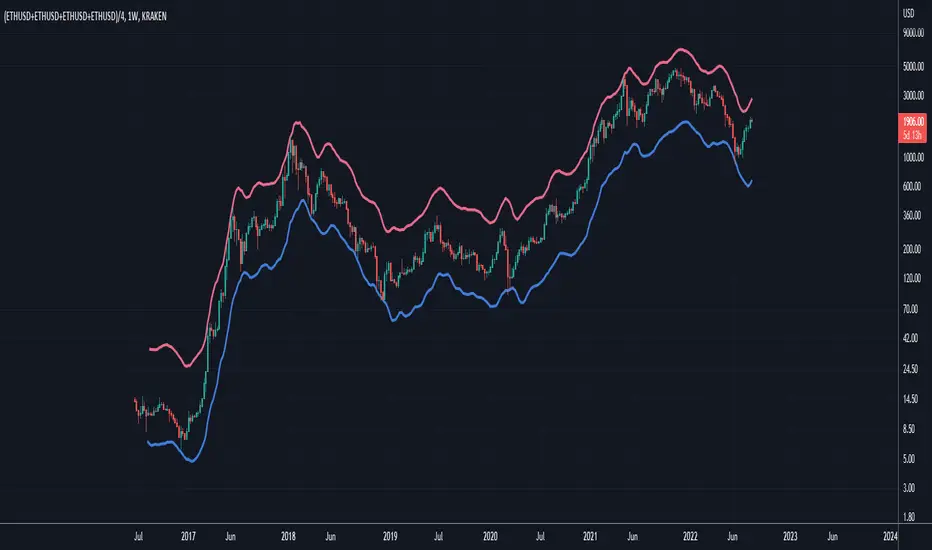
Similar to "Bitcoin: Confidence Bands", this script is designed to show regions of positive and negative overextension for Ethereum, where price is expected to either reverse long-term or at least shorter-term, using custom price loops tuned for the Ethereum case. Again, the idea is that one can be highly confident that Ethereum's price stays within the Confidence Bands, especially when looking at weekly closes. It might be wise to reduce exposure to Ethereum when price gets very near to the red band, and vice versa for an approach of the blue band. Of course this constitutes no financial advice, and one should always consider all available information for making trading decisions.
Settings
This indicator should only be used:
- with the default inputs (but of course feel free to play around a bit for testing purposes)
- on the weekly (W) time frame
- and for the following ticker setup, used to get well averaged Ethereum price data (ideally just copy this and paste it into the ticker field in the upper left area of the chart interface): (KRAKEN:ETHUSD+COINBASE:ETHUSD+BITFINEX:ETHUSD+POLONIEX:ETHUSD)/4
Otherwise the intended functionality cannot be guaranteed.
Access
For access please contact me via DM on TradingView or on Twitter (linked on my TradingView profile and in my signature).
發行說明
Added Accumulation Bands that can be used during the cycle accumulation phase to identify regions of over- and underextension. The acumulation phase is here defined as starting from the absolute cycle bottom and ending at the next Bitcoin halving. Outside this defined market phase the accumulation bands get increasingly inefficient as stronger impulses and crashes occur during bullmarket and bearmarket respectively, leading to frequent breaches of those bands. For bull- and bearmarkets the classic Confidence Bands should be used.The image below shows the two hitherto existing accumulation phases for Ethereum marked with blue semi-transparent boxes, and the corresponding price touches of the yellow and cyan Accumulation Bands. Note that in the second accumulation phase the March 2020 black swan liquidity crisis happened, which led to a breach of the lower Accumulation Band down to the lower Confidence Band.
https://www.tradingview.com/x/pZyR4hyS/
Note that the Accumulation Bands are hidden from the chart by default when you apply the indicator to your chart, but can be activated in the Input Settings menu.
發行說明
Added the Resolution parameter, which should always be kept on weekly time frame in the Input Settings menu. With this, the Confidence Bands can correctly be observed on the daily (and other) time frames.發行說明
Due to data feed problems with Poloniex exchange, it is now recommended to use the ETHEREUM ALL TIME HISTORY INDEX *or* (KRAKEN:ETHUSD+COINBASE:ETHUSD+BITFINEX:ETHUSD+BITSTAMP:ETHUSD)/4 as the ticker.發行說明
Code update to Pinescript v6.發行說明
Minor code fix.僅限邀請腳本
僅作者批准的使用者才能訪問此腳本。您需要申請並獲得使用許可,通常需在付款後才能取得。更多詳情,請依照作者以下的指示操作,或直接聯絡Dean_Trader。
TradingView不建議在未完全信任作者並了解其運作方式的情況下購買或使用腳本。您也可以在我們的社群腳本中找到免費的開源替代方案。
作者的說明
DM me for further information.
免責聲明
這些資訊和出版物並非旨在提供,也不構成TradingView提供或認可的任何形式的財務、投資、交易或其他類型的建議或推薦。請閱讀使用條款以了解更多資訊。
僅限邀請腳本
僅作者批准的使用者才能訪問此腳本。您需要申請並獲得使用許可,通常需在付款後才能取得。更多詳情,請依照作者以下的指示操作,或直接聯絡Dean_Trader。
TradingView不建議在未完全信任作者並了解其運作方式的情況下購買或使用腳本。您也可以在我們的社群腳本中找到免費的開源替代方案。
作者的說明
DM me for further information.
免責聲明
這些資訊和出版物並非旨在提供,也不構成TradingView提供或認可的任何形式的財務、投資、交易或其他類型的建議或推薦。請閱讀使用條款以了解更多資訊。