OPEN-SOURCE SCRIPT
CM EMA Trend Bars
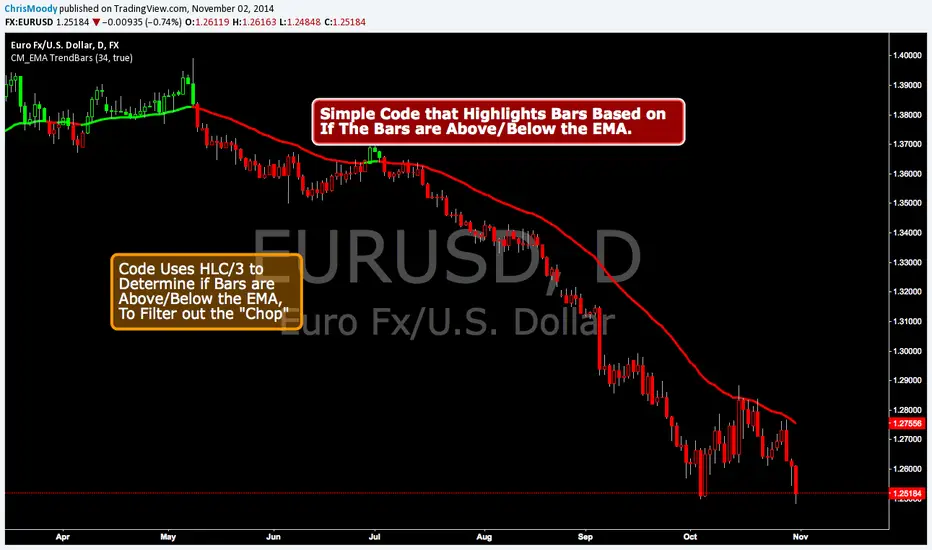
This Code Simply Changes the Bar Colors based on if the Bar is Above or Below the EMA.
Inputs via the Inputs Tab:
Ability to change the EMA Period.
Ability to Turn On/Off the EMA Plotted on the Screen
***Note - I used the HLC/3 To determine if the bar/candle is above or below the EMA. This Filters out the Chop and gets rid of many of the False Breaks above or below the EMA.
Inputs via the Inputs Tab:
Ability to change the EMA Period.
Ability to Turn On/Off the EMA Plotted on the Screen
***Note - I used the HLC/3 To determine if the bar/candle is above or below the EMA. This Filters out the Chop and gets rid of many of the False Breaks above or below the EMA.
開源腳本
本著TradingView的真正精神,此腳本的創建者將其開源,以便交易者可以查看和驗證其功能。向作者致敬!雖然您可以免費使用它,但請記住,重新發佈程式碼必須遵守我們的網站規則。
Coming Soon: ChrisMoodyTrading.com
免責聲明
這些資訊和出版物並不意味著也不構成TradingView提供或認可的金融、投資、交易或其他類型的意見或建議。請在使用條款閱讀更多資訊。
開源腳本
本著TradingView的真正精神,此腳本的創建者將其開源,以便交易者可以查看和驗證其功能。向作者致敬!雖然您可以免費使用它,但請記住,重新發佈程式碼必須遵守我們的網站規則。
Coming Soon: ChrisMoodyTrading.com
免責聲明
這些資訊和出版物並不意味著也不構成TradingView提供或認可的金融、投資、交易或其他類型的意見或建議。請在使用條款閱讀更多資訊。