OPEN-SOURCE SCRIPT
Smart Relative Strength Can Remove False Signals
Relative strength is one of the most useful indicators in the market, highlighting when stocks and sectors are outperforming or underperforming a broader index.
Traditional RS compares the percentage change of one symbol over a given time frame and subtracts the percentage change of the S&P 500 over the same period.
This is handy, but it can produce false signals at times of volatility. For example, when the broader market is crashing, certain sectors may “outperform” simply by falling less than the S&P 500.
Smart Relative Strength addresses this shortcoming by requiring that the symbol’s absolute AND relative returns both be positive. Otherwise a zero is returned.
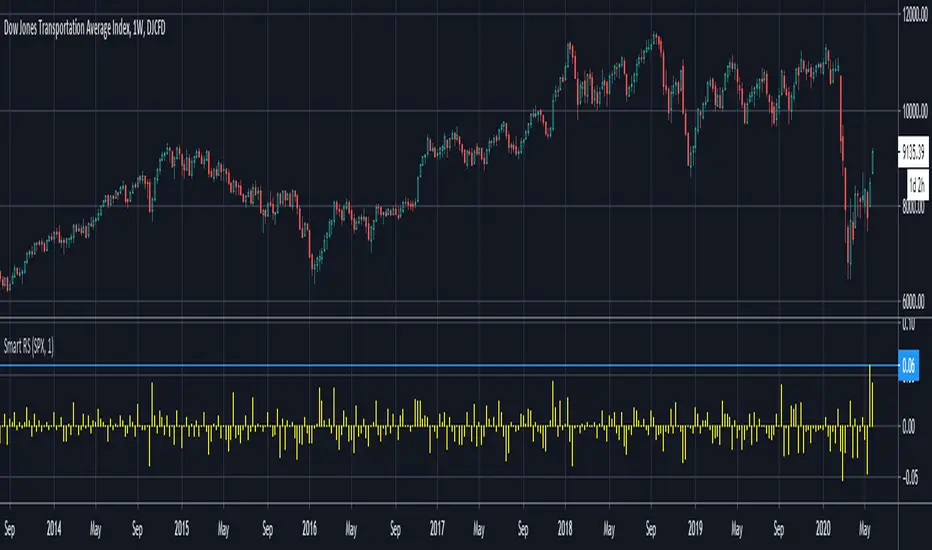
This was useful last week on the Dow Jones Transportation Average. Using simple relative strength, it had its best one-week performance against the S&P 500 since October 2008. This was obviously a false signal because October 2008 was a time that everything else was crashing.
Smart Relative Strength showed that, excluding periods of overall decline, DJT had its best week since January 2008.
Note: This chart uses a 1-period interval, while the code defaults to 21 periods.
Traditional RS compares the percentage change of one symbol over a given time frame and subtracts the percentage change of the S&P 500 over the same period.
This is handy, but it can produce false signals at times of volatility. For example, when the broader market is crashing, certain sectors may “outperform” simply by falling less than the S&P 500.
Smart Relative Strength addresses this shortcoming by requiring that the symbol’s absolute AND relative returns both be positive. Otherwise a zero is returned.
This was useful last week on the
Smart Relative Strength showed that, excluding periods of overall decline, DJT had its best week since January 2008.
Note: This chart uses a 1-period interval, while the code defaults to 21 periods.
開源腳本
本著TradingView的真正精神,此腳本的創建者將其開源,以便交易者可以查看和驗證其功能。向作者致敬!雖然您可以免費使用它,但請記住,重新發佈程式碼必須遵守我們的網站規則。
免責聲明
這些資訊和出版物並不意味著也不構成TradingView提供或認可的金融、投資、交易或其他類型的意見或建議。請在使用條款閱讀更多資訊。
開源腳本
本著TradingView的真正精神,此腳本的創建者將其開源,以便交易者可以查看和驗證其功能。向作者致敬!雖然您可以免費使用它,但請記住,重新發佈程式碼必須遵守我們的網站規則。
免責聲明
這些資訊和出版物並不意味著也不構成TradingView提供或認可的金融、投資、交易或其他類型的意見或建議。請在使用條款閱讀更多資訊。