INVITE-ONLY SCRIPT
Auto Trendline, Downtrend Descending Trend line indicator
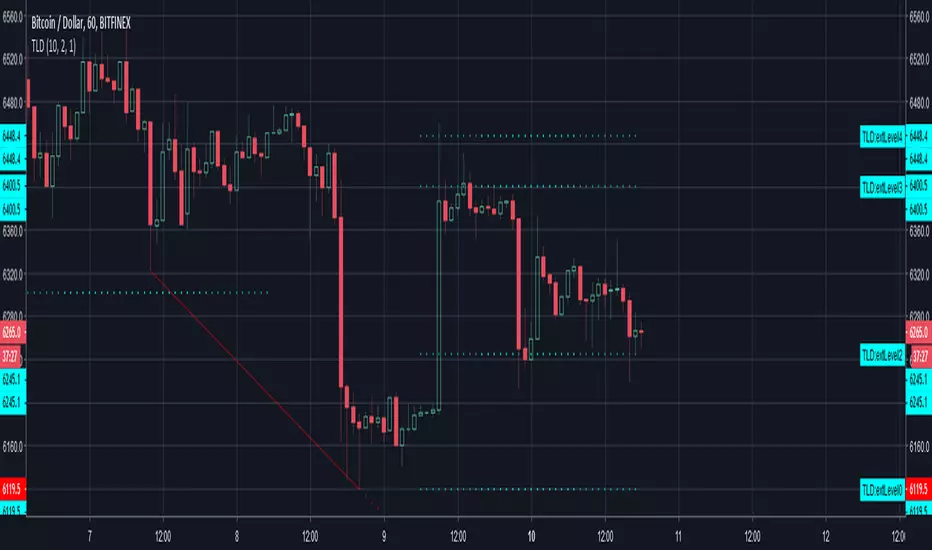
This is a customized Tradingview indicator will automatically plots descending trend lines which formed by two adjacent swing lows. It will also draw 5 extended resistance and support levels after the trend line detected.
The concept is simple: the trend line is formed by two adjacent troughs when the price is in a downtrend . It will save a lot of time for people (like me) who uses trendline very often.
By deploying this indicator, should the condition meet, you don't need to draw the trend lines by hand anymore. It's also very easy to use, just load it on chart and set your desired inputs.
Features:
Strength, this parameter is used to define the minimum number of bars to the left and right side of the troughs (swing low point).
Set price difference between two troughs in two variables: amount or percentage.
Enable/disable the extended level lines.
By using different inputs, you can easily filter out some unwanted trend lines.
It's recommended to use small value for price difference input on intraday chart, and use relatively large value on Daily chart.
The choice of price difference value input also depends on the market you work on, you may want to use small value on Forex market and use large value on Stock market.
僅限邀請腳本
僅作者批准的使用者才能訪問此腳本。您需要申請並獲得使用許可,通常需在付款後才能取得。更多詳情,請依照作者以下的指示操作,或直接聯絡Patternsmart。
TradingView不建議在未完全信任作者並了解其運作方式的情況下購買或使用腳本。您也可以在我們的社群腳本中找到免費的開源替代方案。
作者的說明
免責聲明
這些資訊和出版物並非旨在提供,也不構成TradingView提供或認可的任何形式的財務、投資、交易或其他類型的建議或推薦。請閱讀使用條款以了解更多資訊。
僅限邀請腳本
僅作者批准的使用者才能訪問此腳本。您需要申請並獲得使用許可,通常需在付款後才能取得。更多詳情,請依照作者以下的指示操作,或直接聯絡Patternsmart。
TradingView不建議在未完全信任作者並了解其運作方式的情況下購買或使用腳本。您也可以在我們的社群腳本中找到免費的開源替代方案。
作者的說明
免責聲明
這些資訊和出版物並非旨在提供,也不構成TradingView提供或認可的任何形式的財務、投資、交易或其他類型的建議或推薦。請閱讀使用條款以了解更多資訊。