OPEN-SOURCE SCRIPT
Exponential Smoothing Filter
The digital exponential filter, in finance known as Exponential Moving Average (EMA), can be used as a technical indicator for chart analysis to visualize uptrends and downtrends in the market. Unlike the classic simple moving average, the EMA requires only two values for its calculation: the last calculated exponential average price and the current price. This is a simple and fast calculation - even for wide smoothing windows. For further details and the math please refer to the "exponential smoothing" article on Wikipedia.
Here are some additional key points about the exponential moving average:
[u]How to use[/u]
When you add the script to your charts, you'll immediately see a thin [color=orange]orange line[/orange] across your time series, smoothing out price fluctuations.
There are only two parameters to set
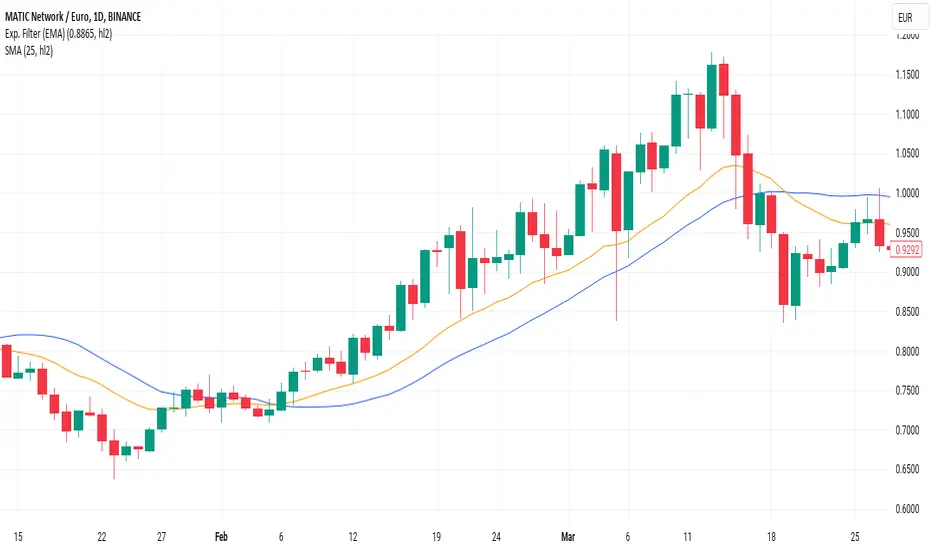
[u]Chart output[/u]
In the example chart above, you can see that the orange line follows the highs and lows better than the [color=blue]blue line[/color], which is a simple moving average (SMA).
Additionally, the orange line has a shorter lag, or reacts faster when the trend of the original price data suddenly changes. These characteristics are critical for buying and selling decisions: quickly reacting and tracking highs and lows while providing a smooth line that filters out distracting noise.
Here are some additional key points about the exponential moving average:
- The EMA can react more quickly to price changes because it can give more weight to current prices - depending on your parameter settings.
- Short-term, disruptive price fluctuations are smoothed out well, making prevailing trends more visible.
- Despite good smoothing properties, it delays the input values slightly, so it can follow sudden trend changes well.
- The EMA is well suited to dynamic markets and trading strategies.
- The filter is a good basis for further processing such as gradient analysis.
[u]How to use[/u]
When you add the script to your charts, you'll immediately see a thin [color=orange]orange line[/orange] across your time series, smoothing out price fluctuations.
There are only two parameters to set
- smoothing factor between 0.0000 = no smoothing and 0.9999 = strong smoothing
- input source: open, high, low, close hl2, etc.
[u]Chart output[/u]
In the example chart above, you can see that the orange line follows the highs and lows better than the [color=blue]blue line[/color], which is a simple moving average (SMA).
Additionally, the orange line has a shorter lag, or reacts faster when the trend of the original price data suddenly changes. These characteristics are critical for buying and selling decisions: quickly reacting and tracking highs and lows while providing a smooth line that filters out distracting noise.
開源腳本
秉持TradingView一貫精神,這個腳本的創作者將其設為開源,以便交易者檢視並驗證其功能。向作者致敬!您可以免費使用此腳本,但請注意,重新發佈代碼需遵守我們的社群規範。
免責聲明
這些資訊和出版物並非旨在提供,也不構成TradingView提供或認可的任何形式的財務、投資、交易或其他類型的建議或推薦。請閱讀使用條款以了解更多資訊。
開源腳本
秉持TradingView一貫精神,這個腳本的創作者將其設為開源,以便交易者檢視並驗證其功能。向作者致敬!您可以免費使用此腳本,但請注意,重新發佈代碼需遵守我們的社群規範。
免責聲明
這些資訊和出版物並非旨在提供,也不構成TradingView提供或認可的任何形式的財務、投資、交易或其他類型的建議或推薦。請閱讀使用條款以了解更多資訊。