OPEN-SOURCE SCRIPT
Normalized Average True Range
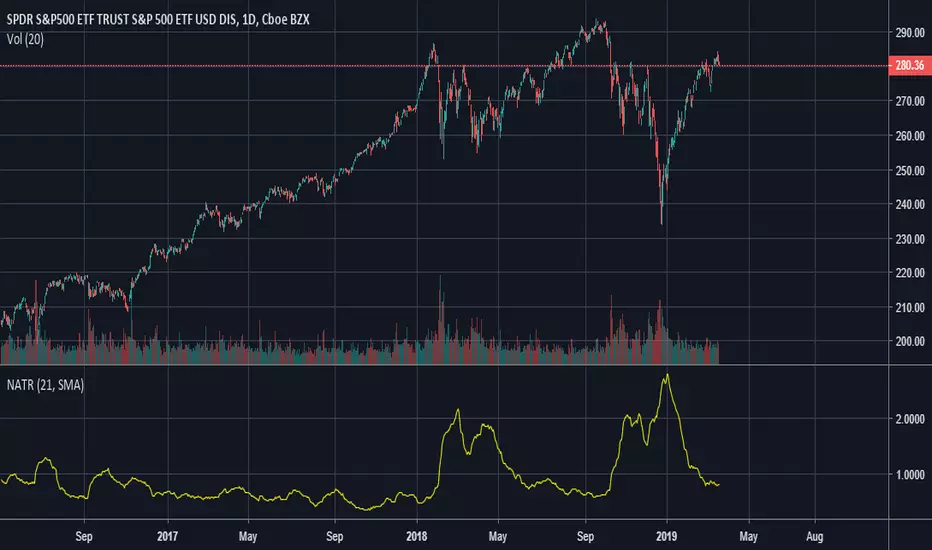
This is a Normalized ATR, which means it displays ATR as a percentage instead of absolute price. For example, a value of 1 indicates a true range of 1% in a given period.
This indicator creates a moving average of the volatility of a product going back X number of periods and is useful for deciding what to trade. For example, if used on a daily chart, one product displays a value of 4 you can reasonably expect it to have larger price swings and movement compared to another product that displays 1.
It does not predict direction, rather the size of moves.
開源腳本
秉持TradingView一貫精神,這個腳本的創作者將其設為開源,以便交易者檢視並驗證其功能。向作者致敬!您可以免費使用此腳本,但請注意,重新發佈代碼需遵守我們的社群規範。
免責聲明
這些資訊和出版物並非旨在提供,也不構成TradingView提供或認可的任何形式的財務、投資、交易或其他類型的建議或推薦。請閱讀使用條款以了解更多資訊。
開源腳本
秉持TradingView一貫精神,這個腳本的創作者將其設為開源,以便交易者檢視並驗證其功能。向作者致敬!您可以免費使用此腳本,但請注意,重新發佈代碼需遵守我們的社群規範。
免責聲明
這些資訊和出版物並非旨在提供,也不構成TradingView提供或認可的任何形式的財務、投資、交易或其他類型的建議或推薦。請閱讀使用條款以了解更多資訊。