INVITE-ONLY SCRIPT
已更新 Market Profile-By Atropine
What is Market profile ?
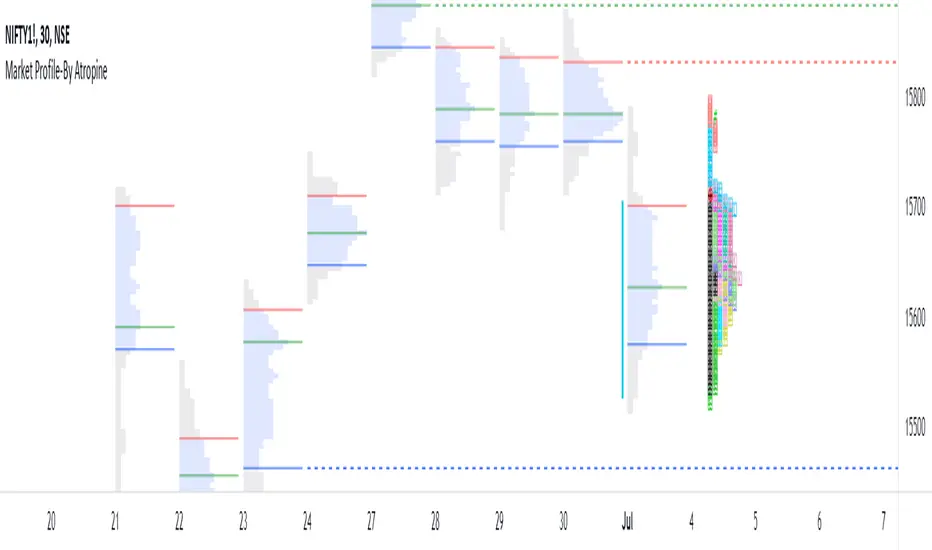
- Market profile is a style of plotting "Price" on the Y-axis and "Time" on the X-axis, which most of the time form a bell-shaped image as the body of the profile.
It helps day traders identify Other Timeframe Participants (Big players) who have money and information power. short-term traders have to follow these big sharks which give direction to markets. - It provides an X-ray vision about the market as Value Area represents 70% of the day’s activity and this will give a clear picture of the current state of the market as it unfolds.
- It works in all market conditions. Usually, a trading system or indicator works in certain market conditions like a trending or sideways market. There is no such restriction to Market Profile as it clearly shows the balanced and imbalanced market conditions in both directions all the time.
How does this Market Profile Indicator Works ?- Automatically plots TPO's for Each half an hour(30min) of the trading day, it is designated by a letter, which is also called Time Price Opportunity(TPO) for the current day. Indicator provides Option to Change TPO Text.
- First 30 min range denoted with the letter ‘A,’ next 30 min range with the letter ‘B’ ,this two TPO are black colored which Indicates IB (Initial Balance) Range. IB Range is the first one-hour range in the market created by retail traders (most of the time).
- Indicator plots TPO continue until the last range of the market, hence the last range is denoted with ‘M’ as the Indian markets currently trade from 9.15 am to 3.30 pm with the last session ‘M” is for only 15 minutes from 3.15 pm to 3.30 pm.
- Letter ‘O’ indicates the open price level, which is red colored and Letter ‘#’ indicates the closing price level which is green in colored.
- This Indicator gives you an Option to choose the color of each TPO's.
- Two Methods of Market Profile one is ‘Split’ profile, and another is ‘Un-Split’ profile, Indicator gives Option to Split or Unsplit the last day profile.
- This Indicator gives you an Options to extend Untested Lines(POC,VAH,VAL)The Price level in which maximum time was spent or maximum trading activity happened is called as Point of Control (POC).Value Area (VA) is the 70% price range around POC. It is the fair price of the Instrument on the particular day.
- Retail traders can only provide market depth and liquidity, but they fail to give magnitude and direction to the price.
- By the end of every trading day, the market profile chart shows not only what happened on that day, but also who is responsible and when it happened.
- Automatically plots TPO's for Each half an hour(30min) of the trading day, it is designated by a letter, which is also called Time Price Opportunity(TPO) for the current day. Indicator provides Option to Change TPO Text.
發行說明
Minimal Optimization.發行說明
- Fixed Close TPO Error while Splitting profile
- Minimal Optimization.
發行說明
- Fixed the Timeframe Error
發行說明
- Improved Script Loading Speed
發行說明
IB Line Error Removed僅限邀請腳本
只有經作者授權的使用者才能訪問此腳本,且通常需付費。您可以將此腳本加入收藏,但需先向作者申請並獲得許可後才能使用 — 點擊此處了解更多。如需更多詳情,請依照作者說明或直接聯繫Bharatgawande12。
除非您完全信任其作者並了解腳本的工作原理,否則TradingView不建議您付費或使用腳本。您也可以在我們的社群腳本中找到免費的開源替代方案。
作者的說明
This is Invite only Indicator, You have to get Subscription to access it,from https://atropine.in
提醒:在請求訪問權限之前,請閱讀僅限邀請腳本指南。
免責聲明
這些資訊和出版物並不意味著也不構成TradingView提供或認可的金融、投資、交易或其他類型的意見或建議。請在使用條款閱讀更多資訊。
僅限邀請腳本
只有經作者授權的使用者才能訪問此腳本,且通常需付費。您可以將此腳本加入收藏,但需先向作者申請並獲得許可後才能使用 — 點擊此處了解更多。如需更多詳情,請依照作者說明或直接聯繫Bharatgawande12。
除非您完全信任其作者並了解腳本的工作原理,否則TradingView不建議您付費或使用腳本。您也可以在我們的社群腳本中找到免費的開源替代方案。
作者的說明
This is Invite only Indicator, You have to get Subscription to access it,from https://atropine.in
提醒:在請求訪問權限之前,請閱讀僅限邀請腳本指南。
免責聲明
這些資訊和出版物並不意味著也不構成TradingView提供或認可的金融、投資、交易或其他類型的意見或建議。請在使用條款閱讀更多資訊。