OPEN-SOURCE SCRIPT
Asset Selection Indicator by [VanHelsing]
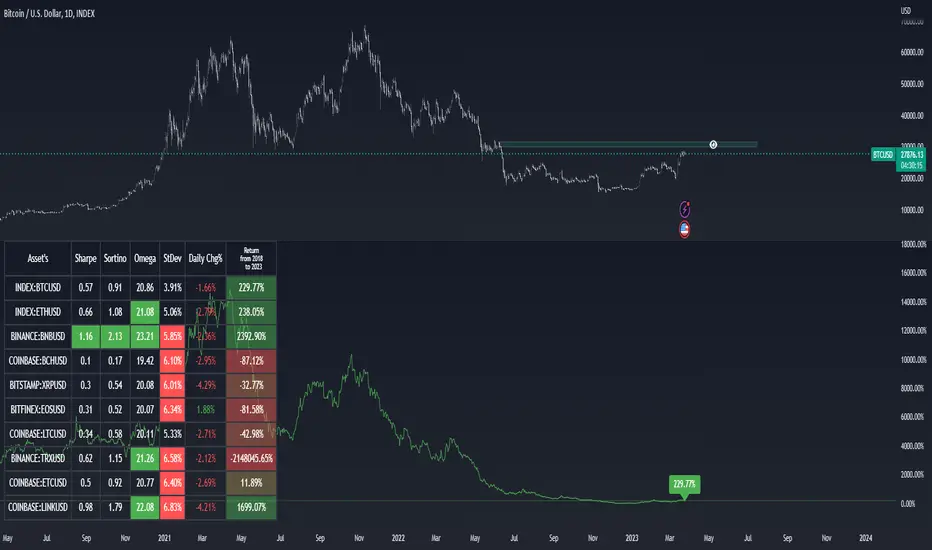
Asset Selection Indicator
This is a table what will help you to see what asset's are optimal to use in your portfolio or strategies.
By different metrics what are ploted on a table you will see how each individual asset performe compare to other
Sharpe, sortino, omega ratio's are very valueble metriscs in bulding portfolio and now you can easly see them without difficult calculations.
Do you want to know return of asset for 3, 5, 2 years? You are welcome to choose in settings whatever period you want, the same for other metrics
Below is instruction how to use this indicator:
(Explanation of Settings for a period of data)

(Asset selection by Sharpe, Omega, Sortino, StDev)

(How to plot Equity)

And a nice bonus is an alert!
(you can send it to a spreadsheet like I explained in other my indicator "Stock Correlation Table")

This is a table what will help you to see what asset's are optimal to use in your portfolio or strategies.
By different metrics what are ploted on a table you will see how each individual asset performe compare to other
Sharpe, sortino, omega ratio's are very valueble metriscs in bulding portfolio and now you can easly see them without difficult calculations.
Do you want to know return of asset for 3, 5, 2 years? You are welcome to choose in settings whatever period you want, the same for other metrics
Below is instruction how to use this indicator:
(Explanation of Settings for a period of data)
(Asset selection by Sharpe, Omega, Sortino, StDev)
(How to plot Equity)
And a nice bonus is an alert!
(you can send it to a spreadsheet like I explained in other my indicator "Stock Correlation Table")
開源腳本
本著TradingView的真正精神,此腳本的創建者將其開源,以便交易者可以查看和驗證其功能。向作者致敬!雖然您可以免費使用它,但請記住,重新發佈程式碼必須遵守我們的網站規則。
免責聲明
這些資訊和出版物並不意味著也不構成TradingView提供或認可的金融、投資、交易或其他類型的意見或建議。請在使用條款閱讀更多資訊。
開源腳本
本著TradingView的真正精神,此腳本的創建者將其開源,以便交易者可以查看和驗證其功能。向作者致敬!雖然您可以免費使用它,但請記住,重新發佈程式碼必須遵守我們的網站規則。
免責聲明
這些資訊和出版物並不意味著也不構成TradingView提供或認可的金融、投資、交易或其他類型的意見或建議。請在使用條款閱讀更多資訊。