INVITE-ONLY SCRIPT
FX Bull_TradersStream
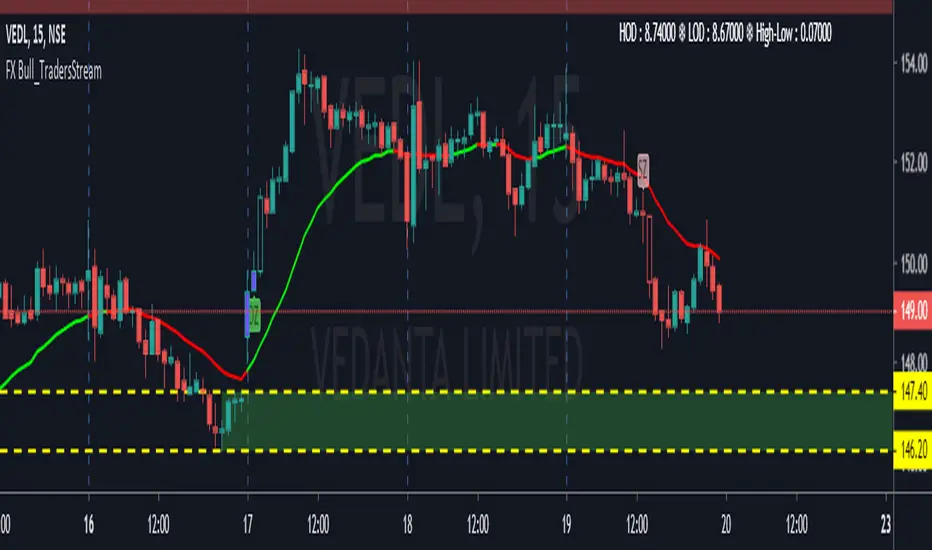
Complete Solution for Trading. In this Indicator
1. Oscillators = In that you will find EMA, SMA & Bollinger Band
2. Length = It's Length of EMA & SMA
3. Demand Zone = Wherever you find "DZ" Label and with that Trend and Location is in your favour than you can go Long from that zone. And another thing you can choose base Quantity Up to 6 Bases.
4. Supply Zone = Wherever you find "SZ" Label and with that Trend and Location is in your favour than you can go Short from that zone. And another thing you can choose base Quantity Up to 6 Bases.
5. Higher Time Frame = Choose this thing so, tool can know what is your Higher Time Frame accordingly this it will judge your ITF & LTF.
6. Higher Distal & Lower Distal = Please enter manually the no.'s of your Upper Distal Line & Lower Distal Line. and when changing chart don't forget to make it "0"
7. Trend @ ITF = Choose your Trend. (Please choose your Trend from your ITF (Intermediate Time Frame)Time frame, to get better results)
9. Risk As per DATR in % = Calculates as per DATR (Daily Average True Range)
10. 1st Symbol & 2nd Symbol = To have other symbol price in your chart.
11. Explosive Candle & Basing Candle = Tick to view Explosive & Boring candle in zone formations & Untick hide the indication.
僅限邀請腳本
只有經作者授權的使用者才能訪問此腳本,且通常需付費。您可以將此腳本加入收藏,但需先向作者申請並獲得許可後才能使用 — 點擊此處了解更多。如需更多詳情,請依照作者說明或直接聯繫mohsinsait3。
除非您完全信任其作者並了解腳本的工作原理,否則TradingView不建議您付費或使用腳本。您也可以在我們的社群腳本中找到免費的開源替代方案。
作者的說明
提醒:在請求訪問權限之前,請閱讀僅限邀請腳本指南。
免責聲明
這些資訊和出版物並不意味著也不構成TradingView提供或認可的金融、投資、交易或其他類型的意見或建議。請在使用條款閱讀更多資訊。
僅限邀請腳本
只有經作者授權的使用者才能訪問此腳本,且通常需付費。您可以將此腳本加入收藏,但需先向作者申請並獲得許可後才能使用 — 點擊此處了解更多。如需更多詳情,請依照作者說明或直接聯繫mohsinsait3。
除非您完全信任其作者並了解腳本的工作原理,否則TradingView不建議您付費或使用腳本。您也可以在我們的社群腳本中找到免費的開源替代方案。
作者的說明
提醒:在請求訪問權限之前,請閱讀僅限邀請腳本指南。
免責聲明
這些資訊和出版物並不意味著也不構成TradingView提供或認可的金融、投資、交易或其他類型的意見或建議。請在使用條款閱讀更多資訊。