INVITE-ONLY SCRIPT
Trendgetter: Trend Detection, Regime Change, Bias Filter by [CR]
Trendgetter: Trend Detection, Regime Change, Bias Filter by Cryptorhythms
“If you are not a trend setter, at least be able to exploit the ones you see.”
― Jeffrey Fry
Intro
Cryptorhythms back again with a members only indicator for trend capture this time! Trendgetter is not crypto specific and can be applied to a variety of timeframes, markets, and tickers. Its meant to be a general purpose trading aid and bias filter, providing reliable trend, bias and regime change information.
Introduction
This indicator relies upon various methods related to probabilities/statistics, digital signal processing and data science to predict optimal fair local price given any financial time series data. The goal was to create a tool that isolates trends and captures their bias, making it easier to follow a noisy market. The focus is making high hit rate uncorrelated returns to your base market. The way in which this indicator is constructed is not based upon any previous public work, and was researched and refined over a period of 6 months of trading and testing based on my own personal trading experiences and observations of the market. I use novel techniques I developed in house to denoise the data and determine a local fair price.
Description
The parameters in this indicator are mostly fixed and do not lend themselves to overfitting. So when you find good settings, its probably legit and not a false positive. They were pre-determined based on my own testing and research to handle almost all possible combinations of price action for determining trends. By fixing some parameters, you automatically reduce the chances of overfitting to historical data. The pre determined levels were carefully chosen after many options were considered.
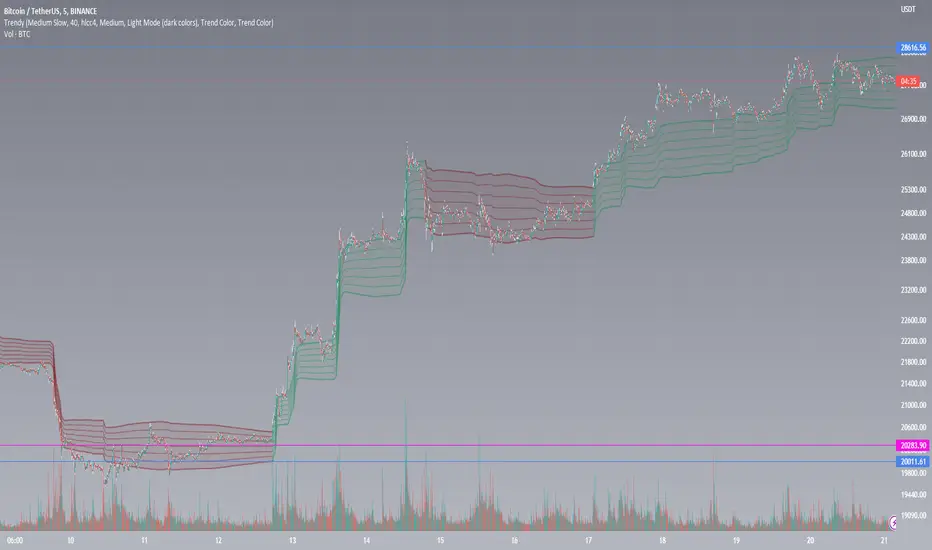
Not just a bias filtooor, fair price predictooor and regime change detectoooor though! TG also provides a price envelope feature which shows a likely fair price range that price will distribute itself upon. Above or below the envelope indicates the presence of a very strong trend. Within the envelope indicates consolidation, but still conforming to the bias. TG then uses a statistics-based approach to display a likely range that price could potentially travel over the near term which we called a price envelope.
An additional option provides background coloration when there is the potential for a regime change on the trend bias. This can be used as a feature to help you manage your trades risk. This is simply measured by an internal (non exposed) script value returning to a mean which triggers the color to appear.
Further Explanation of Settings
-Timeframe: Change the timeframe the indicator is calculated on allowing you to for instance use the 15m Trendgetter output while remaining on the 5 minute chart.
-Trend Capture: This is the "type" of trend you are trying to follow. The different options will attempt to find the trends at various levels of noise cancellation within the lookback period you specify. "Reactive" means it will quickly change its bias and capture smaller trends. "Slow" means it will filter more noise and capture larger trends. "Adaptive" is completely in its own class of behavior and was my attempt to mix both a slow and reactive profile into one setting, it uses a few market metrics like volume and volatility to adjust parameters on the fly.
-Sample Length: Bars to consider in the calculation. Using large numbers here is not going to help, but rather hurt your results. Generally 10-100 is the range you should use for the best results. The exact value will depend on the timeframe, volatility and market/asset you are trading, and you should experiment to find it. (There is no "one size fits all" for potential trading situations)
-Source: Data series used for calculation. I recommend hlcc4 or hl2 or hlc3 instead of just "close." This will help to pre process a noisy data series for the rest of the algo.
-Certainty Level: This setting effects how easily the indicator will confirm a new trend and change its bias. " Reactive" does just as it says and will confirm new regimes faster, but can also lead to false signals or "flip flop" in certain types of price action. "Slow" will change biases less frequently or in conjunction with large moves - but this level of certainty requires the sacrifice of reactivity meaning its a bit laggy (but thats ok when you are following a larger trend). "Medium" is as you would expect the middle ground between reactive and slow. Lastly "Adaptive" tends to fall between reactive and medium in its behavior typically, but it will somewhat adjust itself to suit the variability of market conditions.
-Price Envelope:
-----My own personally created price distribution spread (not monte carlo based)
-----Above or below the envelope indicates the presence of a very strong trend. You should not be fading a trend when its in this position!
-----Within the envelope indicates consolidation, but still conforming to the bias.
User Requests:
Of course we also listen to the needs of our members and added these features upon request.
-Added dark mode and light mode themes.
----Dark Mode is for dark/black charts and uses lighter colorations
----Light mode is for light/white charts and uses darker colorations
-More updates to display and color selection options such as background colors and fill colors.
“If you are not a trend setter, at least be able to exploit the ones you see.”
― Jeffrey Fry
Intro
Cryptorhythms back again with a members only indicator for trend capture this time! Trendgetter is not crypto specific and can be applied to a variety of timeframes, markets, and tickers. Its meant to be a general purpose trading aid and bias filter, providing reliable trend, bias and regime change information.
Introduction
This indicator relies upon various methods related to probabilities/statistics, digital signal processing and data science to predict optimal fair local price given any financial time series data. The goal was to create a tool that isolates trends and captures their bias, making it easier to follow a noisy market. The focus is making high hit rate uncorrelated returns to your base market. The way in which this indicator is constructed is not based upon any previous public work, and was researched and refined over a period of 6 months of trading and testing based on my own personal trading experiences and observations of the market. I use novel techniques I developed in house to denoise the data and determine a local fair price.
Description
The parameters in this indicator are mostly fixed and do not lend themselves to overfitting. So when you find good settings, its probably legit and not a false positive. They were pre-determined based on my own testing and research to handle almost all possible combinations of price action for determining trends. By fixing some parameters, you automatically reduce the chances of overfitting to historical data. The pre determined levels were carefully chosen after many options were considered.
Not just a bias filtooor, fair price predictooor and regime change detectoooor though! TG also provides a price envelope feature which shows a likely fair price range that price will distribute itself upon. Above or below the envelope indicates the presence of a very strong trend. Within the envelope indicates consolidation, but still conforming to the bias. TG then uses a statistics-based approach to display a likely range that price could potentially travel over the near term which we called a price envelope.
An additional option provides background coloration when there is the potential for a regime change on the trend bias. This can be used as a feature to help you manage your trades risk. This is simply measured by an internal (non exposed) script value returning to a mean which triggers the color to appear.
Further Explanation of Settings
-Timeframe: Change the timeframe the indicator is calculated on allowing you to for instance use the 15m Trendgetter output while remaining on the 5 minute chart.
-Trend Capture: This is the "type" of trend you are trying to follow. The different options will attempt to find the trends at various levels of noise cancellation within the lookback period you specify. "Reactive" means it will quickly change its bias and capture smaller trends. "Slow" means it will filter more noise and capture larger trends. "Adaptive" is completely in its own class of behavior and was my attempt to mix both a slow and reactive profile into one setting, it uses a few market metrics like volume and volatility to adjust parameters on the fly.
-Sample Length: Bars to consider in the calculation. Using large numbers here is not going to help, but rather hurt your results. Generally 10-100 is the range you should use for the best results. The exact value will depend on the timeframe, volatility and market/asset you are trading, and you should experiment to find it. (There is no "one size fits all" for potential trading situations)
-Source: Data series used for calculation. I recommend hlcc4 or hl2 or hlc3 instead of just "close." This will help to pre process a noisy data series for the rest of the algo.
-Certainty Level: This setting effects how easily the indicator will confirm a new trend and change its bias. " Reactive" does just as it says and will confirm new regimes faster, but can also lead to false signals or "flip flop" in certain types of price action. "Slow" will change biases less frequently or in conjunction with large moves - but this level of certainty requires the sacrifice of reactivity meaning its a bit laggy (but thats ok when you are following a larger trend). "Medium" is as you would expect the middle ground between reactive and slow. Lastly "Adaptive" tends to fall between reactive and medium in its behavior typically, but it will somewhat adjust itself to suit the variability of market conditions.
-Price Envelope:
-----My own personally created price distribution spread (not monte carlo based)
-----Above or below the envelope indicates the presence of a very strong trend. You should not be fading a trend when its in this position!
-----Within the envelope indicates consolidation, but still conforming to the bias.
User Requests:
Of course we also listen to the needs of our members and added these features upon request.
-Added dark mode and light mode themes.
----Dark Mode is for dark/black charts and uses lighter colorations
----Light mode is for light/white charts and uses darker colorations
-More updates to display and color selection options such as background colors and fill colors.
僅限邀請腳本
只有經作者授權的使用者才能訪問此腳本,且通常需付費。您可以將此腳本加入收藏,但需先向作者申請並獲得許可後才能使用 — 點擊此處了解更多。如需更多詳情,請依照作者說明或直接聯繫theheirophant。
除非您完全信任其作者並了解腳本的工作原理,否則TradingView不建議您付費或使用腳本。您也可以在我們的社群腳本中找到免費的開源替代方案。
作者的說明
Indicator is reserved for members to prevent decay as long as possible. You can view my signature at the bottom of this post for more information on membership. Membership seats are also capped each year so its FCFS basis (as of 3/20/2023: 7/10 filled)
提醒:在請求訪問權限之前,請閱讀僅限邀請腳本指南。
Twitter - twitter.com/cryptorhythms
Cryptorhythms Group Chat - t.me/cryptorhythms
Cryptorhythms Group Chat - t.me/cryptorhythms
免責聲明
這些資訊和出版物並不意味著也不構成TradingView提供或認可的金融、投資、交易或其他類型的意見或建議。請在使用條款閱讀更多資訊。