OPEN-SOURCE SCRIPT
Market Performance by Yearly Seasons [LuxAlgo]
The Market Performance by Yearly Seasons tool allows traders to analyze the average returns of the four seasons of the year and the raw returns of each separate season.
🔶 USAGE

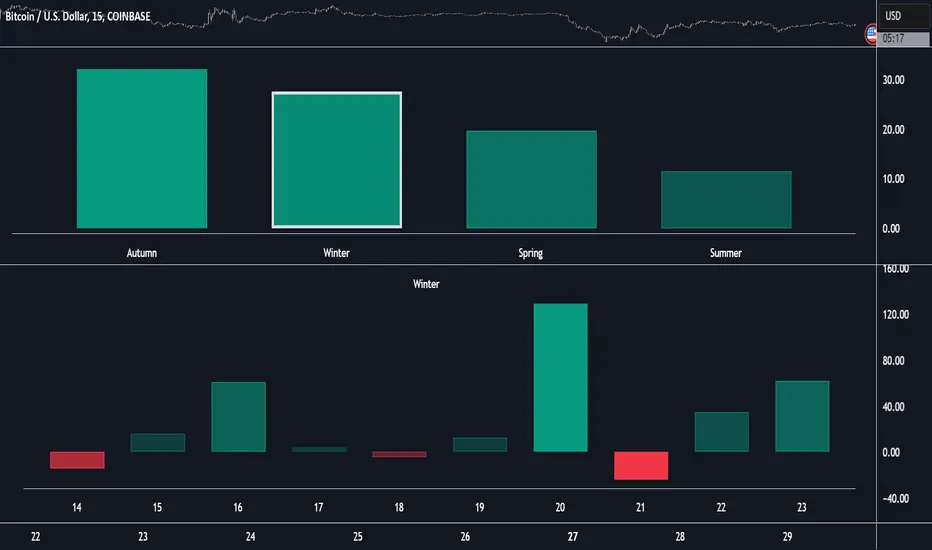
By default, the tool displays the average returns for each season over the last 10 years in the form of bars, with the current session highlighted as a bordered bar.
Traders can choose to display the raw returns by year for each season separately and select the maximum number of seasons (years) to display.
🔹 Hemispheres

Traders can select the hemisphere in which they prefer to view the data.
🔹 Season Types

Traders can select the type of seasons between meteorological (by default) and astronomical.
The meteorological seasons are as follows:
The astronomical seasons are as follows:
🔹 Displaying the data

Traders can choose between two display modes, average returns by season or raw returns by season and year.
🔶 SETTINGS
🔹 Style
🔶 USAGE
By default, the tool displays the average returns for each season over the last 10 years in the form of bars, with the current session highlighted as a bordered bar.
Traders can choose to display the raw returns by year for each season separately and select the maximum number of seasons (years) to display.
🔹 Hemispheres
Traders can select the hemisphere in which they prefer to view the data.
🔹 Season Types
Traders can select the type of seasons between meteorological (by default) and astronomical.
The meteorological seasons are as follows:
- Autumn: months from September to November
- Winter: months from December to February
- Spring: months from March to May
- Summer: months from June to August
The astronomical seasons are as follows:
- Autumn: from the equinox on September 22
- Winter: from the solstice on December 21
- Spring: from the equinox on March 20
- Summer: from the solstice on June 21
🔹 Displaying the data
Traders can choose between two display modes, average returns by season or raw returns by season and year.
🔶 SETTINGS
- Max seasons: Maximum number of seasons
- Hemisphere: Select NORTHERN or SOUTHERN hemisphere
- Season Type: Select the type of season - ASTRONOMICAL or METEOROLOGICAL
- Display: Select display mode, all four seasons, or any one of them
🔹 Style
- Bar Size & Autofit: Select the size of the bars and enable/disable the autofit feature
- Labels Size: Select the label size
- Colors & Gradient: Select the default color for bullish and bearish returns and enable/disable the gradient feature
開源腳本
秉持TradingView一貫精神,這個腳本的創作者將其設為開源,以便交易者檢視並驗證其功能。向作者致敬!您可以免費使用此腳本,但請注意,重新發佈代碼需遵守我們的社群規範。
Get exclusive indicators & AI trading strategies: luxalgo.com
Free 150k+ community: discord.gg/lux
All content provided by LuxAlgo is for informational & educational purposes only. Past performance does not guarantee future results.
Free 150k+ community: discord.gg/lux
All content provided by LuxAlgo is for informational & educational purposes only. Past performance does not guarantee future results.
免責聲明
這些資訊和出版物並非旨在提供,也不構成TradingView提供或認可的任何形式的財務、投資、交易或其他類型的建議或推薦。請閱讀使用條款以了解更多資訊。