Dear all,
I wish a Happy New Year!
The last time I tried to developing a Volume Heatmap, that the Marketorders made.
With the currently version I achieve my skills for that and I present it for everyone - some bugs I cannot solve today.
It also possible to see the POC - also the dynamic of volume developing:


The background for that is to find the pricelevel with the most volume - this is for valuetrading always the target.
If someone find it useful or have question - let me know!
Kind regards
NXT2017
I wish a Happy New Year!
The last time I tried to developing a Volume Heatmap, that the Marketorders made.
With the currently version I achieve my skills for that and I present it for everyone - some bugs I cannot solve today.
It also possible to see the POC - also the dynamic of volume developing:
The background for that is to find the pricelevel with the most volume - this is for valuetrading always the target.
If someone find it useful or have question - let me know!
Kind regards
NXT2017
發行說明
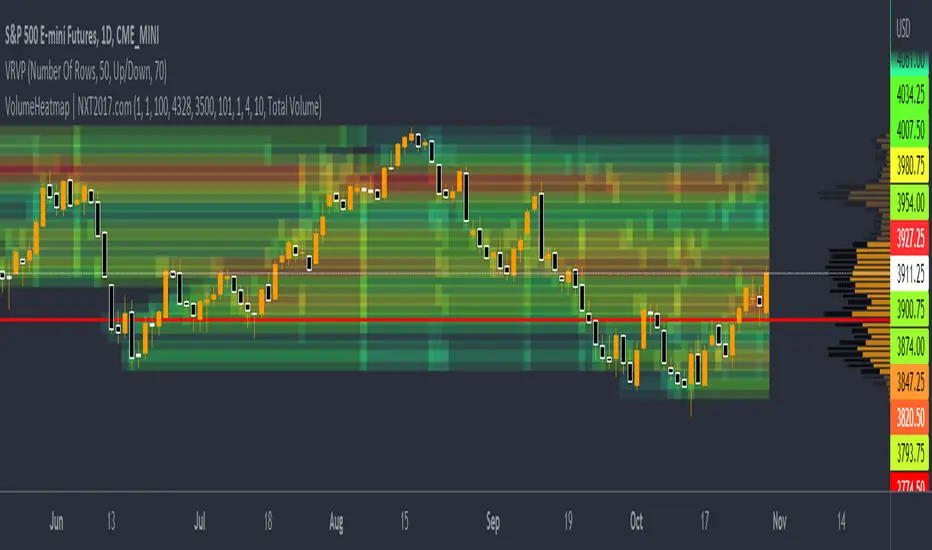
Update of the Heatmap- Change the color printing to thermal falsecolor (high volume are red and low volume are blue/green and the transparency goes from 50% to 100% to avoid overlapping the candles)
- Remove automatic length and High/Low (it's really necessary to choose manuelle high and low price)
- Now you can manage the visible of boxes
How it works:
This indicator plots the maximum allowed lines of 31 that an indicator on TradingView has. For more lines, you need to copy the indicator to the same chart and change the box ID.
This script calculates the volume for every price of past candles that you have to choose on "count bars back". Then the sum of every price is divided through the maximum volume a price level has in this range that was cumulated on the last bars.
How it helps
If you ask how you can use it - I really testing it at now... but I have found is fantastic. You can find the pricelevel that are really nice resistance / support levels. Look here on this examples:
發行說明
*some bugs solved開源腳本
本著TradingView的真正精神,此腳本的創建者將其開源,以便交易者可以查看和驗證其功能。向作者致敬!雖然您可以免費使用它,但請記住,重新發佈程式碼必須遵守我們的網站規則。
🐺 Wolfe Wave AutoPattern: nxt2017.com/ww
🎯 Elliott Wave Auto Counting: nxt2017.com/ew
💥 Impulse Scalper: nxt2017.com/im
📈 Cheapest Entry: nxt2017.com/pi
Discount Coupon:
nxtcoupon20 for -20%
🎯 Elliott Wave Auto Counting: nxt2017.com/ew
💥 Impulse Scalper: nxt2017.com/im
📈 Cheapest Entry: nxt2017.com/pi
Discount Coupon:
nxtcoupon20 for -20%
免責聲明
這些資訊和出版物並不意味著也不構成TradingView提供或認可的金融、投資、交易或其他類型的意見或建議。請在使用條款閱讀更多資訊。
開源腳本
本著TradingView的真正精神,此腳本的創建者將其開源,以便交易者可以查看和驗證其功能。向作者致敬!雖然您可以免費使用它,但請記住,重新發佈程式碼必須遵守我們的網站規則。
🐺 Wolfe Wave AutoPattern: nxt2017.com/ww
🎯 Elliott Wave Auto Counting: nxt2017.com/ew
💥 Impulse Scalper: nxt2017.com/im
📈 Cheapest Entry: nxt2017.com/pi
Discount Coupon:
nxtcoupon20 for -20%
🎯 Elliott Wave Auto Counting: nxt2017.com/ew
💥 Impulse Scalper: nxt2017.com/im
📈 Cheapest Entry: nxt2017.com/pi
Discount Coupon:
nxtcoupon20 for -20%
免責聲明
這些資訊和出版物並不意味著也不構成TradingView提供或認可的金融、投資、交易或其他類型的意見或建議。請在使用條款閱讀更多資訊。