INVITE-ONLY SCRIPT
已更新 Broad Patch Levels + EMA (Daily/Weekly) with Directional Alerts
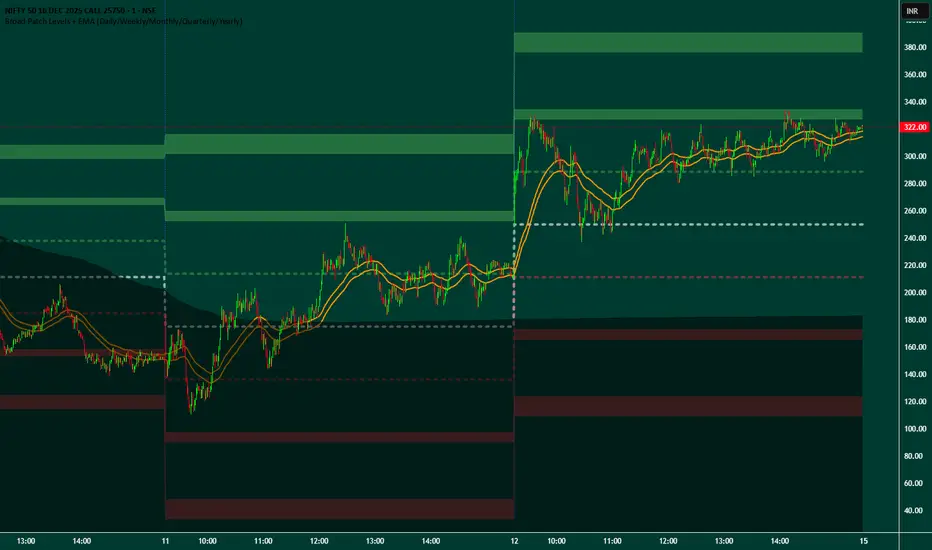
This indicator provides dynamic support and resistance levels along with trend guidance using EMA lines for daily or weekly timeframes. It is fully customizable, offering toggles for individual levels, trend lines, and alert notifications.
Key highlights:
Clearly visualize key market levels for potential trade entries and exits.
Monitor trend direction with EMA-based guidance.
Receive alerts when price interacts with important levels or trend zones.
Configurable visibility and alert options for a clean and personalized chart layout.
Ideal for professional traders looking for a structured, easy-to-read market perspective without exposing proprietary methods or calculations.
發行說明
Broad Patch Levels – Advanced Market Structure is a proprietary price-based reference indicator designed to highlight key intraperiod price zones and dynamic structural areas that evolve as the market unfolds.The indicator automatically adapts to multiple reference horizons, allowing users to observe short-term and higher-timeframe structure without switching chart timeframes.
All calculations are performed internally and are intentionally abstracted from the user interface.
This tool is intended to assist with contextual analysis, directional bias assessment, and reaction-zone identification, rather than providing direct trade instructions.
Core Capabilities
Adaptive Reference Zones
Automatically plots multiple upside and downside zones based on prior market behavior
Zones update only after a reference period completes
Multi-Horizon Support
Supports Daily, Weekly, Monthly, Quarterly, and Yearly structural views
Works on any chart timeframe
Neutral Reference Level
Displays a central reference point for the active period
Dynamic Structure Channel
Highlights evolving market structure using internally derived smoothing logic
Contextual Background Area
Displays a soft, semi-transparent area representing volume-weighted market context
Designed to reduce chart noise while maintaining situational awareness
Visual Control
Toggle individual components on/off
Clean and minimal visual design
僅限邀請腳本
僅作者批准的使用者才能訪問此腳本。您需要申請並獲得使用許可,通常需在付款後才能取得。更多詳情,請依照作者以下的指示操作,或直接聯絡sachinyeola747。
TradingView不建議在未完全信任作者並了解其運作方式的情況下購買或使用腳本。您也可以在我們的社群腳本中找到免費的開源替代方案。
作者的說明
1. Applying the Indicator
Add the indicator to any chart of your choice.
Works best on Daily or Weekly timeframes.
All levels and EMA lines update automatically at the start of each period.
2. Visibility Toggles
You can show or hide individual levels
免責聲明
這些資訊和出版物並非旨在提供,也不構成TradingView提供或認可的任何形式的財務、投資、交易或其他類型的建議或推薦。請閱讀使用條款以了解更多資訊。