INVITE-ONLY SCRIPT
Gann Square of 9 v2- M3M0
The Square of nine or Gann Square or Master Chart is also known as the square root calculator and finds its basis in Gann's methods which is squaring price and time. The square of 9 is a spiral of numbers with the initial value "1" starting at the centre. Starting from this central value, the number is increased as we move in a spiral form and a clockwise direction. According to some experts, each cell in Gann’s square of nine represents a point of vibration.
This indicator will automatically plot the Gann Level based on the Gann Square of 9 table.
How to trade with Gann Square of 9.
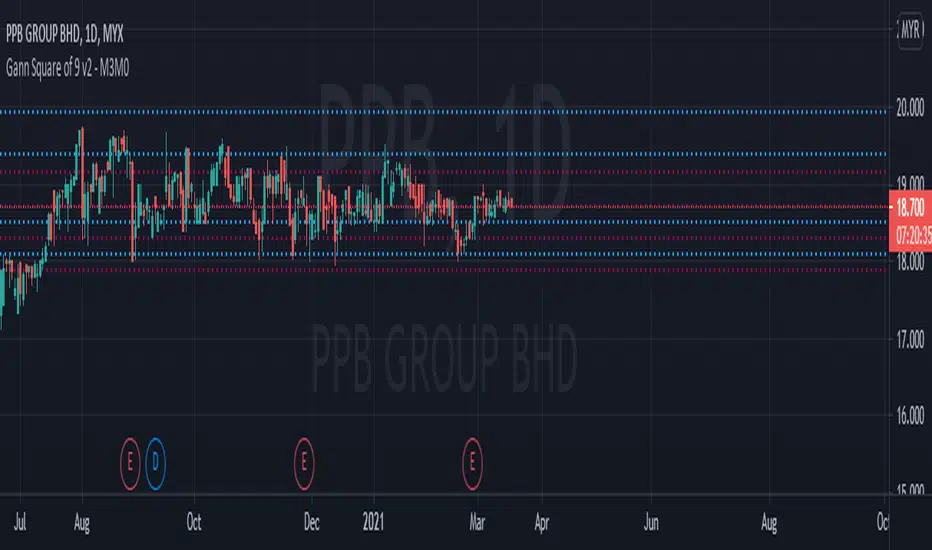
This indicator will automatically plot 4 lines above the current price and 4 lines below the current price, which is based on Gann Square of 9 table.
If the lines above the current price, it will be as resistance. If the lines below the current price, it will be as support.
The blue line is the strong level from Gann Square of 9 table while the red line is the very strong level from Gann Square of 9 table.
This indicator will automatically plot the Gann Level based on the Gann Square of 9 table.
How to trade with Gann Square of 9.
This indicator will automatically plot 4 lines above the current price and 4 lines below the current price, which is based on Gann Square of 9 table.
If the lines above the current price, it will be as resistance. If the lines below the current price, it will be as support.
The blue line is the strong level from Gann Square of 9 table while the red line is the very strong level from Gann Square of 9 table.
免責聲明
這些資訊和出版物並不意味著也不構成TradingView提供或認可的金融、投資、交易或其他類型的意見或建議。請在使用條款閱讀更多資訊。