PROTECTED SOURCE SCRIPT
已更新 Octave Scale - Anchored
Description
The Octave Scale indicator identifies key market levels by multiplying each price point by the twelfth root of 2 (approximately 1.05946), a concept derived from the equal tempered scale in music where each note is spaced evenly to create a consistent step up in frequency. The twelfth root of 2 is used because it represents the precise mathematical interval needed to divide an octave into 12 equal parts, ensuring a balanced progression between each level.
Inspired by the teachings of Michael S. Jenkins, this approach helps traders mark important support and resistance levels, providing a harmonically balanced perspective on market movements. By stepping through these calculated levels, traders can anticipate potential turning points in the market, whether assessing retracement zones or projecting future price targets. The Octave Scale indicator integrates ancient harmonic principles offering a unique tool for understanding and navigating market dynamics.
How to use
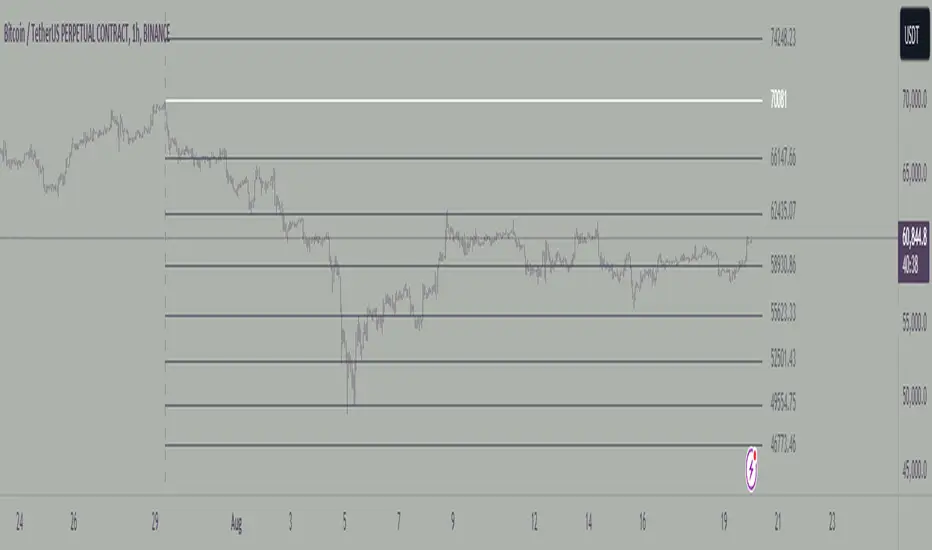
Anchor significant highs or lows and edit the source in settings to reflect the swing.
Indicator in use


The Octave Scale indicator identifies key market levels by multiplying each price point by the twelfth root of 2 (approximately 1.05946), a concept derived from the equal tempered scale in music where each note is spaced evenly to create a consistent step up in frequency. The twelfth root of 2 is used because it represents the precise mathematical interval needed to divide an octave into 12 equal parts, ensuring a balanced progression between each level.
Inspired by the teachings of Michael S. Jenkins, this approach helps traders mark important support and resistance levels, providing a harmonically balanced perspective on market movements. By stepping through these calculated levels, traders can anticipate potential turning points in the market, whether assessing retracement zones or projecting future price targets. The Octave Scale indicator integrates ancient harmonic principles offering a unique tool for understanding and navigating market dynamics.
How to use
Anchor significant highs or lows and edit the source in settings to reflect the swing.
Indicator in use
發行說明
Manual price input added受保護腳本
此腳本以閉源形式發佈。 不過,您可以自由使用,沒有任何限制 — 點擊此處了解更多。
免責聲明
這些資訊和出版物並非旨在提供,也不構成TradingView提供或認可的任何形式的財務、投資、交易或其他類型的建議或推薦。請閱讀使用條款以了解更多資訊。
免責聲明
這些資訊和出版物並非旨在提供,也不構成TradingView提供或認可的任何形式的財務、投資、交易或其他類型的建議或推薦。請閱讀使用條款以了解更多資訊。