PROTECTED SOURCE SCRIPT
Stablecoin Liquidity Delta v2 (Aggregate Market Cap Flow)
Updated version of Stablecoin Liquidity Delta (Aggregate Market Cap Flow).
Hi All,
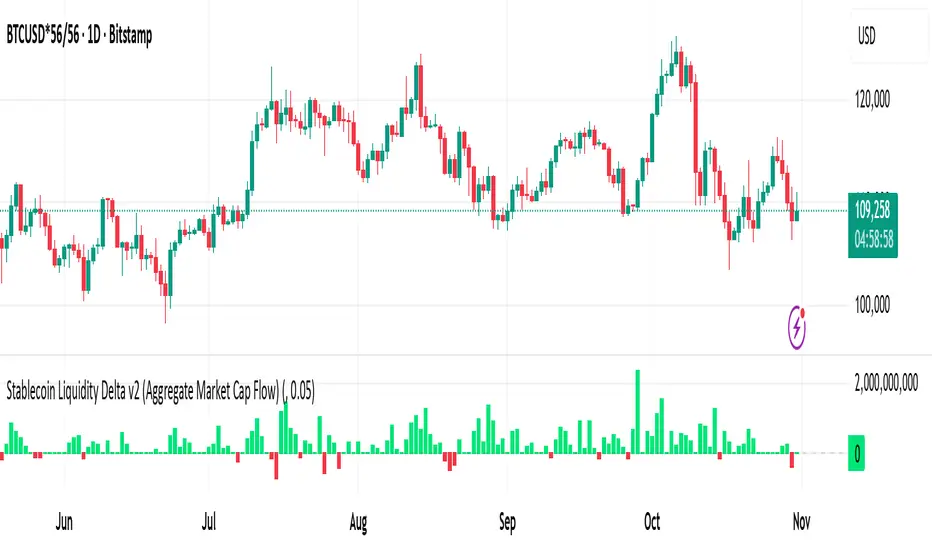
This indicator visualizes the bar-to-bar change in the aggregate market capitalization of major stablecoins, including USDT, USDC, DAI, and others. It serves as a proxy for monitoring on-chain liquidity and measuring capital inflows or outflows across the crypto market.
Stablecoins are the primary liquidity layer of the crypto economy. Their combined market capitalization acts as a mirror of the available fiat-denominated liquidity in digital markets:
🟩 An increase in the total stablecoin market capitalization indicates new issuance (capital entering the market).
🟥 A decrease reflects redemption or burning (liquidity exiting the system).
Tracking these flows helps anticipate macro-level liquidity trends that often lead overall market direction, providing context for broader price movements.
All values are derived from TradingView’s public CRYPTOCAP tickers, which represent the market capitalization of each stablecoin. While minor deviations can occur due to small price fluctuations around the $1 peg, these figures serve as a proxy for circulating supply and net issuance across the stablecoin ecosystem.
Hi All,
This indicator visualizes the bar-to-bar change in the aggregate market capitalization of major stablecoins, including USDT, USDC, DAI, and others. It serves as a proxy for monitoring on-chain liquidity and measuring capital inflows or outflows across the crypto market.
Stablecoins are the primary liquidity layer of the crypto economy. Their combined market capitalization acts as a mirror of the available fiat-denominated liquidity in digital markets:
🟩 An increase in the total stablecoin market capitalization indicates new issuance (capital entering the market).
🟥 A decrease reflects redemption or burning (liquidity exiting the system).
Tracking these flows helps anticipate macro-level liquidity trends that often lead overall market direction, providing context for broader price movements.
All values are derived from TradingView’s public CRYPTOCAP tickers, which represent the market capitalization of each stablecoin. While minor deviations can occur due to small price fluctuations around the $1 peg, these figures serve as a proxy for circulating supply and net issuance across the stablecoin ecosystem.
受保護腳本
此腳本以閉源形式發佈。 不過,您可以自由使用,沒有任何限制 — 點擊此處了解更多。
免責聲明
這些資訊和出版物並非旨在提供,也不構成TradingView提供或認可的任何形式的財務、投資、交易或其他類型的建議或推薦。請閱讀使用條款以了解更多資訊。
免責聲明
這些資訊和出版物並非旨在提供,也不構成TradingView提供或認可的任何形式的財務、投資、交易或其他類型的建議或推薦。請閱讀使用條款以了解更多資訊。