OPEN-SOURCE SCRIPT
Support and Resistance Levels and Zones [Quantigenics]
Support and Resistance Levels and Zones Indicator is an enhanced support and resistance indicator in that typical support and resistance levels are crucial concepts in technical analysis representing price levels where selling or buying momentum tends to halt, typically leading to a price reversal.
The Support and Resistance Levels and Zones Indicator goes beyond static levels by identifying dynamic 'zones'. These zones, depicted as shaded areas, offer more nuanced insights, acknowledging that markets are not rigid but fluctuating entities. Traders can leverage these zones, alongside the standard levels that the indicator plots, to better time their entries and exits, maximizing potential profitability and minimizing risk.
This is a "must-see on your charts" indicator and while scrolling back looking at historical data shows the amazing power of this indicator, it's even better in realtime LIVE price action and the price can tend to hit the Support and Resistance Levels and Zones multiple times intrabar.
 GOLD 1HR

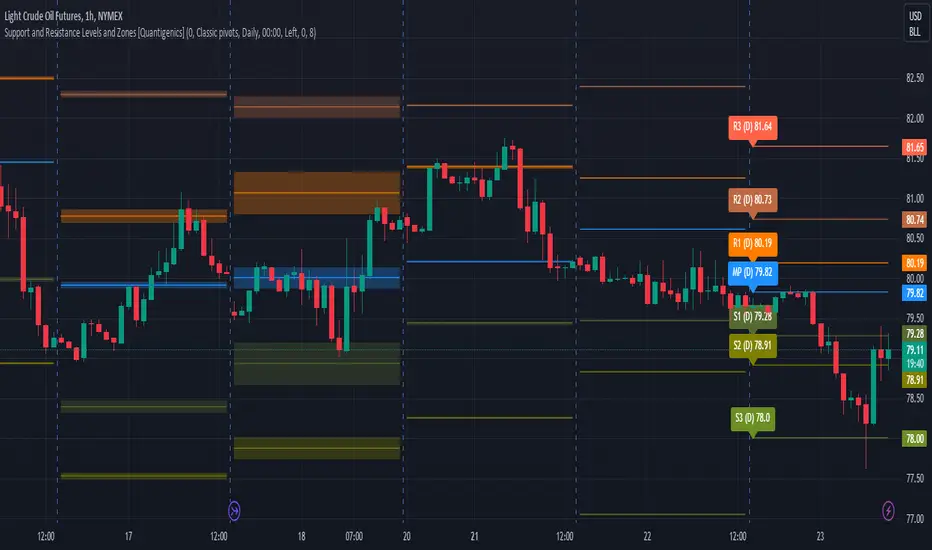
 CL1! 15MIN

Enjoy!
The Support and Resistance Levels and Zones Indicator goes beyond static levels by identifying dynamic 'zones'. These zones, depicted as shaded areas, offer more nuanced insights, acknowledging that markets are not rigid but fluctuating entities. Traders can leverage these zones, alongside the standard levels that the indicator plots, to better time their entries and exits, maximizing potential profitability and minimizing risk.
This is a "must-see on your charts" indicator and while scrolling back looking at historical data shows the amazing power of this indicator, it's even better in realtime LIVE price action and the price can tend to hit the Support and Resistance Levels and Zones multiple times intrabar.
Enjoy!
開源腳本
本著TradingView的真正精神,此腳本的創建者將其開源,以便交易者可以查看和驗證其功能。向作者致敬!雖然您可以免費使用它,但請記住,重新發佈程式碼必須遵守我們的網站規則。
Quantigenics Premium Indicator Suite
Visit quantigenics.com to subscribe
E-mail us at support@quantigenics.com
Happy Trading!
Visit quantigenics.com to subscribe
E-mail us at support@quantigenics.com
Happy Trading!
免責聲明
這些資訊和出版物並不意味著也不構成TradingView提供或認可的金融、投資、交易或其他類型的意見或建議。請在使用條款閱讀更多資訊。