OPEN-SOURCE SCRIPT
52-Week & 5-Year High/Low with Dates
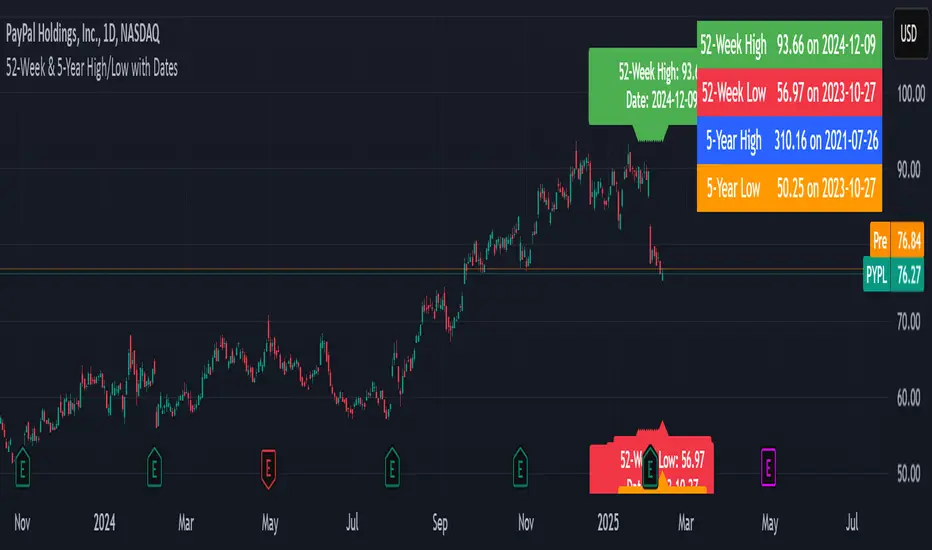
This indicator is designed to help traders quickly identify key price levels and their historical context by displaying the 52-week high/low and 5-year high/low prices along with their respective dates. It provides a clear visual representation of these levels directly on the chart and in a dashboard table for easy reference.
Key Features
52-Week High/Low:
Displays the highest and lowest prices over the last 252 trading days (approximately 52 weeks).
Includes the exact date when these levels were reached.
5-Year High/Low:
Displays the highest and lowest prices over the last 1260 trading days (approximately 5 years).
Includes the exact date when these levels were reached.
Visual Labels:
High and low levels are marked on the chart with labels that include the price and date.
Dashboard Table:
A table in the top-right corner of the chart summarizes the 52-week and 5-year high/low prices and their dates for quick reference.
Customizable Date Format:
Dates are displayed in the YYYY-MM-DD format for clarity and consistency.
開源腳本
秉持TradingView一貫精神,這個腳本的創作者將其設為開源,以便交易者檢視並驗證其功能。向作者致敬!您可以免費使用此腳本,但請注意,重新發佈代碼需遵守我們的社群規範。
免責聲明
這些資訊和出版物並非旨在提供,也不構成TradingView提供或認可的任何形式的財務、投資、交易或其他類型的建議或推薦。請閱讀使用條款以了解更多資訊。
開源腳本
秉持TradingView一貫精神,這個腳本的創作者將其設為開源,以便交易者檢視並驗證其功能。向作者致敬!您可以免費使用此腳本,但請注意,重新發佈代碼需遵守我們的社群規範。
免責聲明
這些資訊和出版物並非旨在提供,也不構成TradingView提供或認可的任何形式的財務、投資、交易或其他類型的建議或推薦。請閱讀使用條款以了解更多資訊。