OPEN-SOURCE SCRIPT
Leonid's Bitcoin Full Cycle Simple SMA Indicator
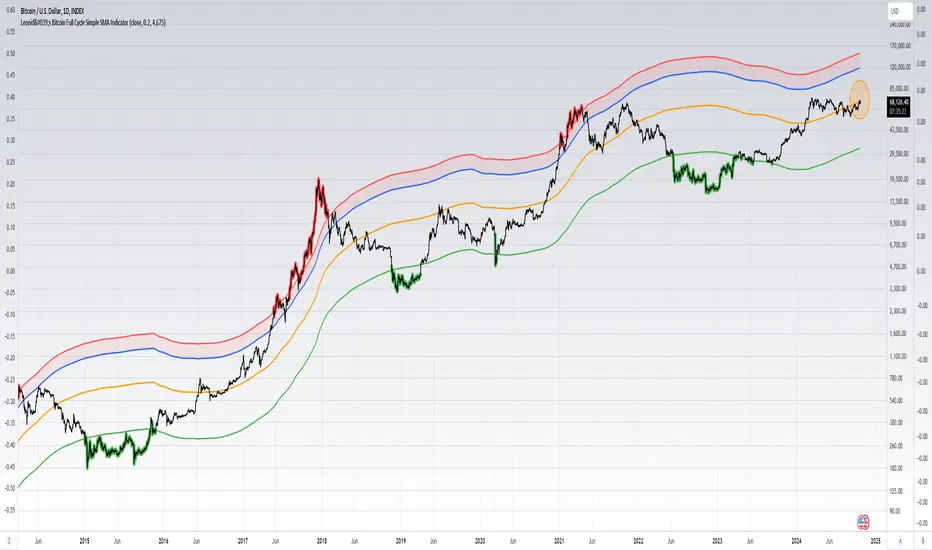
This is a straight-forward and customizable indicator to track Bitcoin cycles, specifically used for helping investors understand where to buy and sell. This is done by using a two year SMA period as the base calculation. With that calculation you create lower and upper bounds for bull market peaks and bear market bottoms.
The novel idea here is that you can customize the SMA "strength" for both the upper and lower bounds as alpha decays over time and price get's less volatile with adoption increasing. The multiples are customizable for both the upper and lower bounds along with a mid-line that will adjust based on the settings input.
Indicators don't always have to rely on crazy math or outlandish ideas to be useful, sometimes even the simplest of inputs can give investors (especially those that are new) a great base case for their strategy. Something being simple does not diminish the idea or strength behind the data.
How to use this indicator: This script must be used on BTCUSD (Bitcoin All-Time History Index) with the y-axis being set to Logarithmic scale.
Details & how to interpret: The price is colored green when Bitcoin enters a "value zone" meaning it is heavily oversold and likely near a bottom for the bear market cycle. The price is colored red when Bitcoin enters an "overbought zone" meaning it is heavily overbought and is likely near a top for the bull market cycle.
Along with the upper and lower bound I have plotted a mid-line (in orange) to establish a neutral zone which helps depict what phase of the cycle we're in (under mid-line = bearish/accumulation phase, over mid-line = bullish/distribution phase).
The inputs for the upper and lower bound are customizable and will need to be adjusted over time as alpha decay will occur as time goes on. Currently the numbers are as follows:
Both inputs can be modified depending on your risk tolerance. Mathematically it is safe to assume these numbers will decrease as time goes on and volatility during cycle peaks & troughs is reduced.
I've also plotted an upper bound "heat zone" which is shaded in green, this area is great for signaling when you should be preparing to begin taking profits. It takes the upper bound and subtracts the lower bound to derive the band.
All the colors are customizable and this indicator is best used on a line chart but can be customized to use on a bar chart/candlestick as well.
Simple Moving Averages are a very basic indicator but are often extremely powerful because the majority of traders/investors are looking at such levels which creates a psychological/herd effect. Another good example is the law of round numbers.
Regardless this script can be adapted with EMAs or additional standard deviations if necessary. If you have any questions or concerns please don't hesitate to message me.
The novel idea here is that you can customize the SMA "strength" for both the upper and lower bounds as alpha decays over time and price get's less volatile with adoption increasing. The multiples are customizable for both the upper and lower bounds along with a mid-line that will adjust based on the settings input.
Indicators don't always have to rely on crazy math or outlandish ideas to be useful, sometimes even the simplest of inputs can give investors (especially those that are new) a great base case for their strategy. Something being simple does not diminish the idea or strength behind the data.
How to use this indicator: This script must be used on
Details & how to interpret: The price is colored green when Bitcoin enters a "value zone" meaning it is heavily oversold and likely near a bottom for the bear market cycle. The price is colored red when Bitcoin enters an "overbought zone" meaning it is heavily overbought and is likely near a top for the bull market cycle.
Along with the upper and lower bound I have plotted a mid-line (in orange) to establish a neutral zone which helps depict what phase of the cycle we're in (under mid-line = bearish/accumulation phase, over mid-line = bullish/distribution phase).
The inputs for the upper and lower bound are customizable and will need to be adjusted over time as alpha decay will occur as time goes on. Currently the numbers are as follows:
0.2 for the lower bound
4.675 for the upper bound
Both inputs can be modified depending on your risk tolerance. Mathematically it is safe to assume these numbers will decrease as time goes on and volatility during cycle peaks & troughs is reduced.
I've also plotted an upper bound "heat zone" which is shaded in green, this area is great for signaling when you should be preparing to begin taking profits. It takes the upper bound and subtracts the lower bound to derive the band.
All the colors are customizable and this indicator is best used on a line chart but can be customized to use on a bar chart/candlestick as well.
Simple Moving Averages are a very basic indicator but are often extremely powerful because the majority of traders/investors are looking at such levels which creates a psychological/herd effect. Another good example is the law of round numbers.
Regardless this script can be adapted with EMAs or additional standard deviations if necessary. If you have any questions or concerns please don't hesitate to message me.
開源腳本
秉持TradingView一貫精神,這個腳本的創作者將其設為開源,以便交易者檢視並驗證其功能。向作者致敬!您可以免費使用此腳本,但請注意,重新發佈代碼需遵守我們的社群規範。
免責聲明
這些資訊和出版物並非旨在提供,也不構成TradingView提供或認可的任何形式的財務、投資、交易或其他類型的建議或推薦。請閱讀使用條款以了解更多資訊。
開源腳本
秉持TradingView一貫精神,這個腳本的創作者將其設為開源,以便交易者檢視並驗證其功能。向作者致敬!您可以免費使用此腳本,但請注意,重新發佈代碼需遵守我們的社群規範。
免責聲明
這些資訊和出版物並非旨在提供,也不構成TradingView提供或認可的任何形式的財務、投資、交易或其他類型的建議或推薦。請閱讀使用條款以了解更多資訊。