PROTECTED SOURCE SCRIPT
已更新 [DMG] REVEREND v2
REVEREND (RSI based Trend Reversal Indicator)
Info:
This is an RSI based convergence divergence (like MACD) indicator using SMAs or DEMAs for smoothing.
You can optionally filter the signals with the stochastic momentum indicator (SMI) levels or via simple overbought/oversold RSI levels.
Signals:
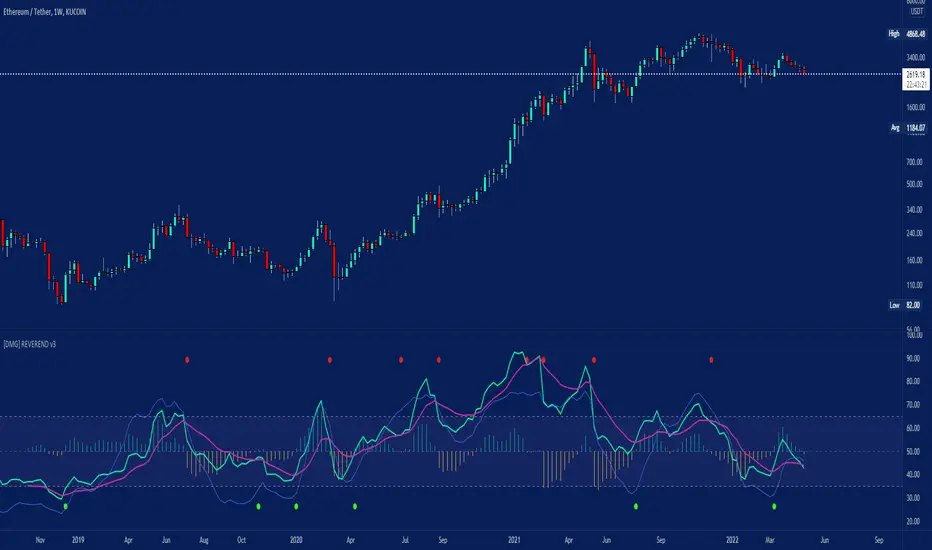
Purple is the Slow MA, Green is the Fast MA, Blue is the SMI (Momentum).
Buy and Sell signals are shown as circles (yellow on top sell, green on bottom buy)
The histogram is for easier differentiation (like macd) zero crossings creating the signals.
Usage:
Settings can never be perfect for any indicator, defaults should be good for BTC, ETH.
Sell signals should be taken with falling momentum, buys with rising momentum.
Watch out for false signals if Momentum is still rising while it prints a sell signal it is most likely false, you can filter these by using longer MAs but then it becomes more lagging.
A sufficiently fast fast-MA can be used for tracking RSI itself and since it also displays the stoch. momentum signal you can also check for divergences yourself or anticipate moves by their slope.
This is my main indicator for a year now and I wish I had followed it more ;) I additionally use EMAs, VWAP, Divergences and Volume Indicators, just remember price is king.
If you have questions or additional ideas I'd be happy to read them!
Good Luck! :D
Info:
This is an RSI based convergence divergence (like MACD) indicator using SMAs or DEMAs for smoothing.
You can optionally filter the signals with the stochastic momentum indicator (SMI) levels or via simple overbought/oversold RSI levels.
Signals:
Purple is the Slow MA, Green is the Fast MA, Blue is the SMI (Momentum).
Buy and Sell signals are shown as circles (yellow on top sell, green on bottom buy)
The histogram is for easier differentiation (like macd) zero crossings creating the signals.
Usage:
Settings can never be perfect for any indicator, defaults should be good for BTC, ETH.
Sell signals should be taken with falling momentum, buys with rising momentum.
Watch out for false signals if Momentum is still rising while it prints a sell signal it is most likely false, you can filter these by using longer MAs but then it becomes more lagging.
A sufficiently fast fast-MA can be used for tracking RSI itself and since it also displays the stoch. momentum signal you can also check for divergences yourself or anticipate moves by their slope.
This is my main indicator for a year now and I wish I had followed it more ;) I additionally use EMAs, VWAP, Divergences and Volume Indicators, just remember price is king.
If you have questions or additional ideas I'd be happy to read them!
Good Luck! :D
發行說明
REVEREND ( RSI based Trend Reversal Indicator)Info:
This is an RSI based convergence divergence (like MACD ) indicator using SMAs or DEMAs for smoothing.
You can optionally filter the signals with the stochastic momentum indicator (SMI) levels or via simple overbought/oversold RSI levels.
Signals:
Purple is the Slow MA, Green is the Fast MA, Blue is the SMI (Momentum).
Buy and Sell signals are shown as circles (yellow on top sell, green on bottom buy)
The histogram is for easier differentiation (like macd ) zero crossings creating the signals.
Usage:
Settings can never be perfect for any indicator, defaults should be good for BTC , ETH.
Sell signals should be taken with falling momentum, buys with rising momentum.
Watch out for false signals if Momentum is still rising while it prints a sell signal it is most likely false, you can filter these by using longer MAs but then it becomes more lagging.
A sufficiently fast fast-MA can be used for tracking RSI itself and since it also displays the stoch . momentum signal you can also check for divergences yourself or anticipate moves by their slope.
This is my main indicator for a year now and I wish I had followed it more ;) I additionally use EMAs, VWAP , Divergences and Volume Indicators, just remember price is king.
If you have questions or additional ideas I'd be happy to read them!
Good Luck! :D
Update v3:
I simplified the UI a bit, made the filters faster, bigger buy/sell icons, edited the defaults so they are a bit better for higher timeframes by default.
Generally you will need to change the settings to accomodate your trading timeframe and use a dataset that has enough history for your settings, this is true for most indicators.
The faster your settings on the MAs and the jumpier the stochastic the more false signals, the slower the more lag is introduced. Its always a balance.
Thanks for trying around.
Good Luck as always.
發行說明
Messed something up with the filter activation in the last update, now they all show when unticked. RSI OB/OS filter has been removed because it wasnt very effective. Changed some colors and sizes etc.受保護腳本
此腳本以閉源形式發佈。 不過,您可以自由使用,沒有任何限制 — 點擊此處了解更多。
免責聲明
這些資訊和出版物並非旨在提供,也不構成TradingView提供或認可的任何形式的財務、投資、交易或其他類型的建議或推薦。請閱讀使用條款以了解更多資訊。
受保護腳本
此腳本以閉源形式發佈。 不過,您可以自由使用,沒有任何限制 — 點擊此處了解更多。
免責聲明
這些資訊和出版物並非旨在提供,也不構成TradingView提供或認可的任何形式的財務、投資、交易或其他類型的建議或推薦。請閱讀使用條款以了解更多資訊。