INVITE-ONLY SCRIPT
[LTS] SyncLine
Find the hidden currents between markets.
What it does
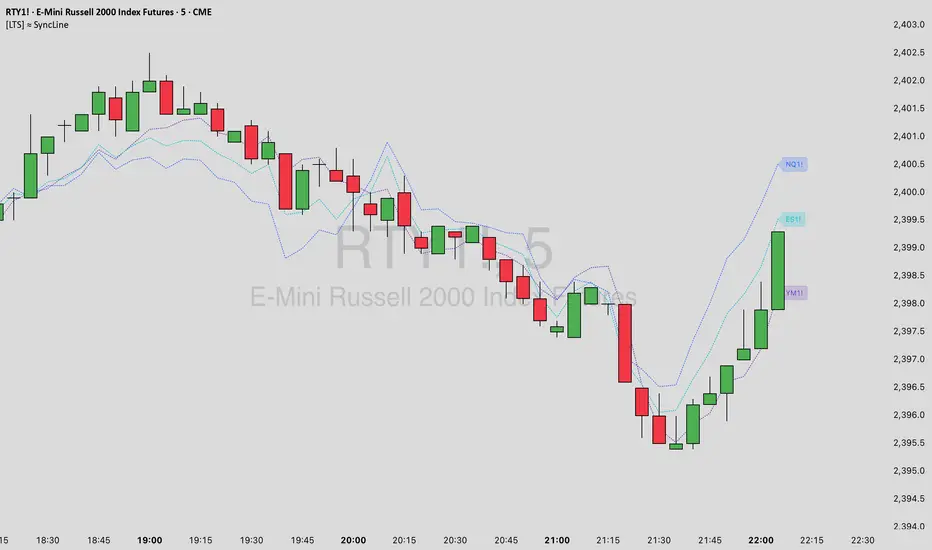
SyncLine overlays up to three cross-asset guide lines on your current chart, translating each selected symbol’s intraday position into the price scale of the chart you’re viewing. The result is a clean, session-aware “sync” of other markets on your chart so you can quickly spot alignment, leadership, and divergence without clutter.
How it works
For each selected symbol, SyncLine calculates that symbol’s intraday position relative to its own session baseline, then projects that position onto your active chart based on its own baseline.
Lines reset each session to remain relevant to the current day’s action.
Optional smoothing makes the guides easier to read during noisy tape.
Note: This script is intraday-only. It will stop with a clear warning if applied to non-intraday timeframes.
Inputs
Symbols
Smoothing
How to use
Add one or more driver markets (e.g., ES, NQ, DXY, sector leaders) to observe when they align with your instrument.
Look for:
Confluence: your price and one or more SyncLines moving together.
Leadership: a SyncLine turns/accelerates before your price.
Divergence: your price disagrees with the majority of SyncLines.
Notes & limitations
Designed for intraday timeframes (1m–1h).
Lines are calculated from completed data and do not repaint after bar close.
Works best during regular liquid sessions; thin markets can reduce signal quality.
Best practices
Pair SyncLine with your execution framework (structure, liquidity zones, time-of-day).
Use distinct colors for each symbol and keep the set small (1–3) for clarity.
What it does
SyncLine overlays up to three cross-asset guide lines on your current chart, translating each selected symbol’s intraday position into the price scale of the chart you’re viewing. The result is a clean, session-aware “sync” of other markets on your chart so you can quickly spot alignment, leadership, and divergence without clutter.
How it works
For each selected symbol, SyncLine calculates that symbol’s intraday position relative to its own session baseline, then projects that position onto your active chart based on its own baseline.
Lines reset each session to remain relevant to the current day’s action.
Optional smoothing makes the guides easier to read during noisy tape.
Note: This script is intraday-only. It will stop with a clear warning if applied to non-intraday timeframes.
Inputs
Symbols
- Show Symbol 1/2/3 – Toggle each overlay line.
- Symbol 1/2/3 – Choose any ticker (e.g., index futures, ETFs, single names).
- Color 1/2/3 – Line colors.
- Labels - Optional labels for each line.
Smoothing
- Enable Smoothing – On/Off.
- Method – EMA / SMA / WMA / RMA.
- Length – 1–50.
How to use
Add one or more driver markets (e.g., ES, NQ, DXY, sector leaders) to observe when they align with your instrument.
Look for:
Confluence: your price and one or more SyncLines moving together.
Leadership: a SyncLine turns/accelerates before your price.
Divergence: your price disagrees with the majority of SyncLines.
Notes & limitations
Designed for intraday timeframes (1m–1h).
Lines are calculated from completed data and do not repaint after bar close.
Works best during regular liquid sessions; thin markets can reduce signal quality.
Best practices
Pair SyncLine with your execution framework (structure, liquidity zones, time-of-day).
Use distinct colors for each symbol and keep the set small (1–3) for clarity.
僅限邀請腳本
只有經作者批准的使用者才能訪問此腳本。您需要申請並獲得使用權限。該權限通常在付款後授予。如欲了解更多詳情,請依照以下作者的說明操作,或直接聯絡LHAMA-Trading。
除非您完全信任其作者並了解腳本的工作原理,否則TradingView不建議您付費或使用腳本。您也可以在我們的社群腳本中找到免費的開源替代方案。
作者的說明
This indicator is part of the LHAMA Trading Suite. See https://lhamatrading.com for access.
提醒:在請求訪問權限之前,請閱讀僅限邀請腳本指南。
Creators of the LHAMA Trading Suite. Visit lhamatrading.com to unlock all our indicators.
Skip the drama, ride the LHAMA!
Skip the drama, ride the LHAMA!
免責聲明
這些資訊和出版物並不意味著也不構成TradingView提供或認可的金融、投資、交易或其他類型的意見或建議。請在使用條款閱讀更多資訊。