INVITE-ONLY SCRIPT
NVME Trend Index

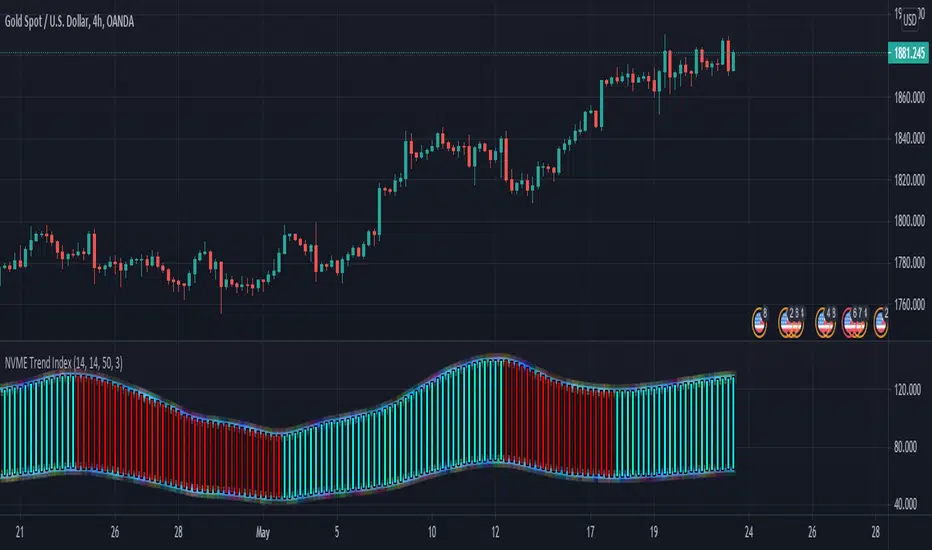
NVME Trend Index is an indicator that confirms the direction of the trend through using a modified linear regression that combines moving averages onto different formulas to create the final result. The main area of the indicator is the columns that are blue and red, these work off the modified linear regression and if a is greater than b then the column will be coloured positively (blue), elsewise it will be negative (red). NVME Trend Index can also be used to identify overbought and oversold zones of the market and due to the way the indicator is outputted it can also be used to identify possible higher highs / lows, lower lows / highs, which can be useful. This can be identified when you zoom out of your charts to see the market structure based on this indicator.
There are only 4 settings to play around with, this is one of our most simplest indicators to use yet.
Setting 1: Index Length [5-30]: This is a number-based input field that has the minimum value of 5 and maximum value of 30, changing the number inside of here will change how fast / slow the bars will switch trends and this also impacts the values of the column's top and bottom.
Setting 2: Reactivity [1-200]: This is another number-based input field that has the minimum value of 1 and the maximum value of 200, changing the number inside of here will add towards how fast / slow the bars will switch trends and the lower it is the faster it is, but this will contain some false columns, increasing it will delay the trend switch however remove most false columns.
Setting 3: Trend Scalar [10-500]: This is another number-based input field that has the minimum value of 10 and the maximum value of 500, changing the number inside of here will impact all of the indicator and the modified linear regression. This will result in smaller or larger columns, faster or slower trend reactions.
Setting 4: Trend Offset [1-20]: This is the modifier for the trend scalar and this will impact its effectiveness at providing faster / slower trend switches.
This indicator is best combined with NVME Vanquisher X Algorithm, support and resistance analysis or your trading style and our NVME Trend Meter X. Though you could use this, enable the trend cloud feature on NVME Vanquisher and use the calls made.
This script comes with all NVME Scripts.
僅限邀請腳本
僅作者批准的使用者才能訪問此腳本。您需要申請並獲得使用許可,通常需在付款後才能取得。更多詳情,請依照作者以下的指示操作,或直接聯絡Crypto_Samm。
TradingView不建議在未完全信任作者並了解其運作方式的情況下購買或使用腳本。您也可以在我們的社群腳本中找到免費的開源替代方案。
作者的說明
You will be granted access on TradingView within 2-8 hours after you purchase on our website: https://www.nvmetrading.com We advise you to take a look at our product and discord group before considering using our services! Docs + discord in our website!
Visit our website to get access: nvmetrading.com
You can also find videos, images, documentation and other resources there too.
Join Our Discord: discord.gg/2CY7BYTySR
You can also find videos, images, documentation and other resources there too.
Join Our Discord: discord.gg/2CY7BYTySR
免責聲明
這些資訊和出版物並非旨在提供,也不構成TradingView提供或認可的任何形式的財務、投資、交易或其他類型的建議或推薦。請閱讀使用條款以了解更多資訊。