PROTECTED SOURCE SCRIPT
Ace Pro GODSPEED Time Based Support Resistance Calculator [FREE]
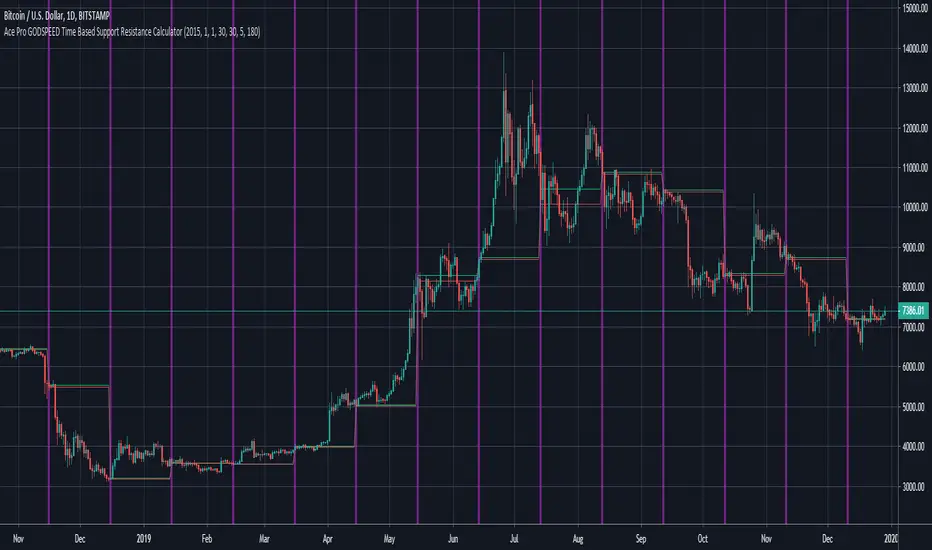
The Ace Pro GODSPEED Time Based Support Resistance Calculator has two functions.
Please note that this indicator is COMPLETELY CUSTOMIZABLE - TRADERS CAN INPUT THEIR OWN VALUES TO CALCULATE S/R.
Function 1: It marks intervals of time on the daily time-frame with vertical lines as specified by the user
Function 2: It can mark support and resistances with horizontal lines as defined by a set of candles for a specified time interval
Function 1 Explanation:
To mark the intervals on the daily time-frame, traders should utilize the following options:
Start Year
Start Month
Start Date
Days Frequency
Traders can select the start date and duration of each interval. The indicator will automatically mark these intervals on the daily chart with a vertical line.
----------------------------------------------------------------------------------------------------------
Function 2 Explanation:
To mark support and resistances, traders should utilize the following options
Low Time Frame
Low Time Frame Value
High Time Frame Value
Low Time Frame = Specify the time frame on which you would like to VIEW the S/R lines
Low Time Frame Value = Select the value of the candle to take into account. For example, if you want the indicator to calculate using 5-minute candles, specify “5” as the input value. However if you want the indicator to calculate using 10-minute candles, specify “10” as the input value.
High Time Frame Value = Specify the total duration you would like S/R values calculated for before the indicator resets its calculation. For example, if you want each calculation to reset after 180 minutes, use the input value of “180”. However, if you want each calculation to reset after 90 minutes, use the input value of “90”.
IMPORTANT NOTICE: SOME EXCHANGES (CRYPTOCURRENCY) ARE MISSING DATA FOR CERTAIN DATES/PERIODS. THIS MAY AFFECT YOUR CALCULATION. THIS IS ESPECIALLY TRUE ON HIGHER TIME-FRAMES (SUCH AS THE DAILY). PLEASE DO KEEP THIS IN MIND.
受保護腳本
此腳本以閉源形式發佈。 不過,您可以自由使用,沒有任何限制 — 點擊此處了解更多。
Send me a message for a special offer! Do you like my analysis? Do you want to stop paying for stop losses and make money? Come trade with me in my private Discord group with this link discord.gg/q5Q7GzVD3h - Send me a DM to start.
免責聲明
這些資訊和出版物並非旨在提供,也不構成TradingView提供或認可的任何形式的財務、投資、交易或其他類型的建議或推薦。請閱讀使用條款以了解更多資訊。