INVITE-ONLY SCRIPT
Grid Premium Indicator - The Quant Science
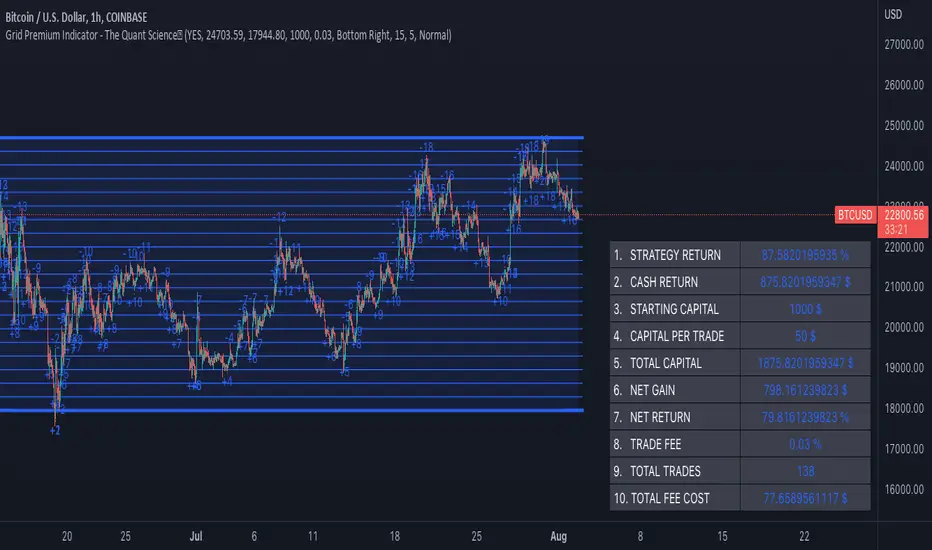
Grid Premium Indicator - The Quant Science™ is an indicator that represent the grid trading strategy. Unlike our GRID SPOT TRADING ALGORITHM (which buys in a "buy the dip" style, offering a swing type operation) this indicator uses a trend following strategy with a larger number of grids.
A trend-following strategy in a grid algorithm allows you to open long positions if price rises and breaks up or open short positions if price breaks down.
This indicator was created following the guidelines of the best grid algorithms on 3Commas, Bitsgap, Kucoin, and Binance.
Our goal is to recreate a universal and trust model for all traders and investors who use grid algorithms for their trading.
The ideal market condition as for all grid algorithms is the side market. In the side market this algorithm will create profit during upward movements.
The trader using this algorithm can use it to:
1. Manual trading
2. Backtesting
3. Algorithmic trading
HOW TO SET UP
Using this indicator is very simple. We have configured the creation for a three-step set up. You can manage it without any problems experience in coding. All you have to do is click the grid start and end level and the indicator will automatically load generating the grids and backtesting.
OPERATIVITY
Each open trade is long and is opened when the price crossover an upward level. Each order is closed at the next level. If the price breaks upward or downward the extremes of the grid the algorithm stops trading and will not open any more positions.
FEATURES
Grids: this indicator generates 20 levels of grids.
Direction: opens exclusively long positions.
Strategy: trend-following.
Data table: a table collects all the quantitative data on the strategy's performance. By entering your broker's commission costs and initial capital you will have an instant report on the strategy's performance.
MAIN ADVANTAGE
Compound Interest: the high number of grids allows the gains from each trade to be reinvested quickly by speeding capitalization through compound interest.
LIMITATIONS OF THE MODEL
Like all grid strategies, maximum profit is made when the market is flat or sideways. A market with a bullish or bearish trend does not allow you to generate good profits with this strategy.
僅限邀請腳本
僅作者批准的使用者才能訪問此腳本。您需要申請並獲得使用許可,通常需在付款後才能取得。更多詳情,請依照作者以下的指示操作,或直接聯絡thequantscience。
TradingView不建議在未完全信任作者並了解其運作方式的情況下購買或使用腳本。您也可以在我們的社群腳本中找到免費的開源替代方案。
作者的說明
You can unlock this indicator from our website. For any information or questions about this script contact us on Trading View private chat.
免責聲明
這些資訊和出版物並非旨在提供,也不構成TradingView提供或認可的任何形式的財務、投資、交易或其他類型的建議或推薦。請閱讀使用條款以了解更多資訊。