OPEN-SOURCE SCRIPT
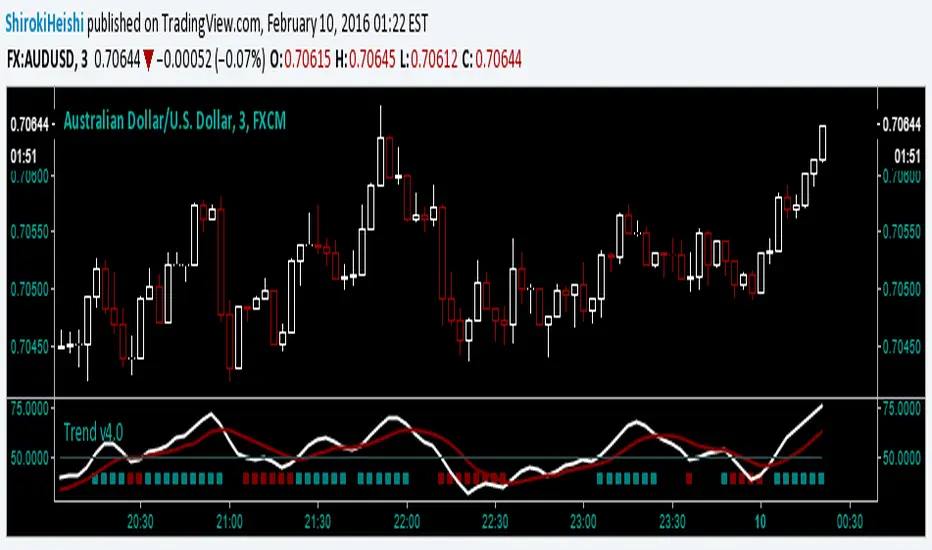
Trend v4.0 Another update

Yet another update, default settings can be customized to your needs. Be aware that while this is similar to the other versions, this can only repaint an active bar, but that slows it down by one period. You are warned. Be that as it may, the basic idea is the same; trying to capture the really strong moves into overbought or oversold territory as defined by Relative Strength index. In RSI mode, you can see the smoothing has slowed it down a bit, but warrants backtesting.
First green bar go long, First red bar go short, first white bar possible trend exhaustion. Or use crossovers and such, play with the inputs OB/OS, RSI length, signal length, tick length, swing length, as I said customize to your tastes. I offer no surety as to its efficacy, but we all learn.
Trade Responsibly,
Shiroki
開源腳本
本著TradingView的真正精神,此腳本的創建者將其開源,以便交易者可以查看和驗證其功能。向作者致敬!雖然您可以免費使用它,但請記住,重新發佈程式碼必須遵守我們的網站規則。
免責聲明
這些資訊和出版物並不意味著也不構成TradingView提供或認可的金融、投資、交易或其他類型的意見或建議。請在使用條款閱讀更多資訊。
開源腳本
本著TradingView的真正精神,此腳本的創建者將其開源,以便交易者可以查看和驗證其功能。向作者致敬!雖然您可以免費使用它,但請記住,重新發佈程式碼必須遵守我們的網站規則。
免責聲明
這些資訊和出版物並不意味著也不構成TradingView提供或認可的金融、投資、交易或其他類型的意見或建議。請在使用條款閱讀更多資訊。