INVITE-ONLY SCRIPT
--SPYDERCRUSHER-- DollarFlow™
SPYDERCRUSHER MARKET RESEARCH
There are many markets, strategies, and investment timeframes, but one thing never changes – accurate, timely information makes a huge difference to your bottom line results.
The SPYderCrusher Market Research Analysis Suite takes the guesswork out of price changes with clear, actionable data, supported by extensive quantitative testing. We help make your work easier, your results better, and your insight more precise.
The Analysis Suite was formerly a paid add-on package in direct partnership with TradingView. It was the highest-selling software on the platform for good reason – it’s effective. To expand our data, features, and user-experience, we made the move to host client resources on our own. Becoming a client is easy – just a few clicks at http://www.scmrtrends.com/services/ and you’re activated!
Aside from software access, membership includes:
- Free upgrades
- Interactive video training & documentation
- Quantitative modeling & resources
All designed specifically to improve your market timing and expertise. Our value proposition clear: the SPYderCrusher Analysis Suite finds attractive opportunities faster and more accurately than competitors. Clear understanding of price changes increases your confidence, saves you time, and lowers your costs.
About SPYderCrusher DollarFlow™
Uses: SPYderCrusher DollarFlow™ normalizes volume into dollars – the benefit is you can see the exact amount of money flowing through a security on any timeframe. Compare different markets with built-in features to measure statistically significant dollar flows in multiple timeframes.
- Easily find breakouts / breakdowns with the highest (or lowest) money flows
- Measure & compare different markets / securities on the same chart
- Create custom time periods
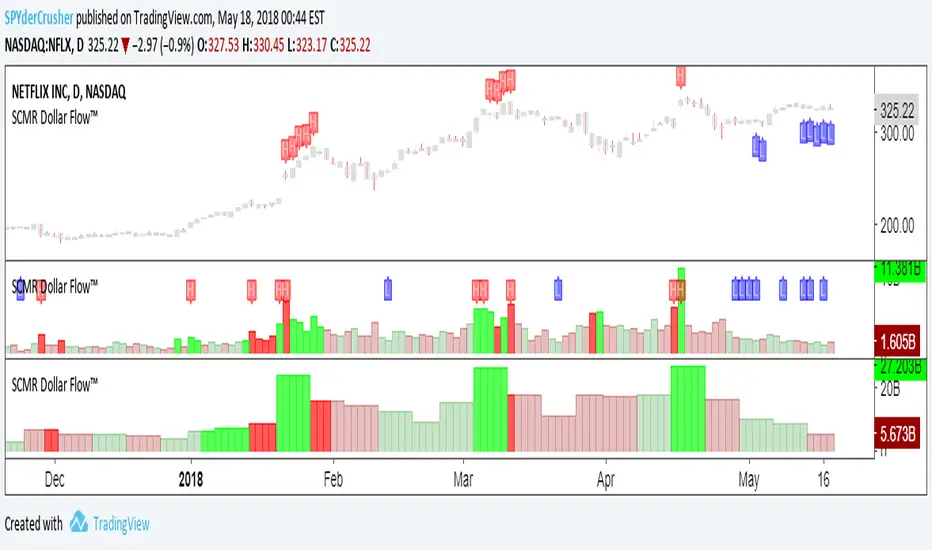
Example Chart Above: The sample chart above shows the SPYderCrusher DollarFlow™ three different ways on NFLX.
NFLX.
- In pane #1, is the standard DollarFlow™. Brighter colors indicate statistically significant readings – this is the normal setting
- One click changes DollarFlow™ to cumulative total for the week (pane #2)
- Another option is to overlay on the main chart, with just the High / Low flags, and custom measurement period to “this week, over the last quarter”
Notice that High “H” flags tend to suggest exhaustion, and short-term mean-reversion, while Low “L” flags suggest continuation of a predominant trend.
Supercharge your volume analysis with SPYderCrusher DollarFlow™. PURCHASE HERE.
_________
Thank you for your interest and your support - it's incredibly appreciated
- Daniel Jassy, CFA
Founder of SPYderCrusher Market Research
About - learn about our background and our expertise in quantitative finance
Email: support [at] scmrtrends [dot] com
Quick Disclosure: Nothing in this writeup / demonstration should ever be considered as advice or an invitation to buy or sell any securities. Please see the Terms of Use / Privacy Policy for a full disclaimer.
The CFA Institute does not endorse, promote, or warrant the accuracy or quality of SPYderCrusher Market Research. CFA® and Chartered Financial Analyst® designations are registered trademarks owned by the CFA Institute.
© 2018 — SPYderCrusher Market Research™. All Rights Reserved.
There are many markets, strategies, and investment timeframes, but one thing never changes – accurate, timely information makes a huge difference to your bottom line results.
The SPYderCrusher Market Research Analysis Suite takes the guesswork out of price changes with clear, actionable data, supported by extensive quantitative testing. We help make your work easier, your results better, and your insight more precise.
The Analysis Suite was formerly a paid add-on package in direct partnership with TradingView. It was the highest-selling software on the platform for good reason – it’s effective. To expand our data, features, and user-experience, we made the move to host client resources on our own. Becoming a client is easy – just a few clicks at http://www.scmrtrends.com/services/ and you’re activated!
Aside from software access, membership includes:
- Free upgrades
- Interactive video training & documentation
- Quantitative modeling & resources
All designed specifically to improve your market timing and expertise. Our value proposition clear: the SPYderCrusher Analysis Suite finds attractive opportunities faster and more accurately than competitors. Clear understanding of price changes increases your confidence, saves you time, and lowers your costs.
About SPYderCrusher DollarFlow™
Uses: SPYderCrusher DollarFlow™ normalizes volume into dollars – the benefit is you can see the exact amount of money flowing through a security on any timeframe. Compare different markets with built-in features to measure statistically significant dollar flows in multiple timeframes.
- Easily find breakouts / breakdowns with the highest (or lowest) money flows
- Measure & compare different markets / securities on the same chart
- Create custom time periods
Example Chart Above: The sample chart above shows the SPYderCrusher DollarFlow™ three different ways on
- In pane #1, is the standard DollarFlow™. Brighter colors indicate statistically significant readings – this is the normal setting
- One click changes DollarFlow™ to cumulative total for the week (pane #2)
- Another option is to overlay on the main chart, with just the High / Low flags, and custom measurement period to “this week, over the last quarter”
Notice that High “H” flags tend to suggest exhaustion, and short-term mean-reversion, while Low “L” flags suggest continuation of a predominant trend.
Supercharge your volume analysis with SPYderCrusher DollarFlow™. PURCHASE HERE.
_________
Thank you for your interest and your support - it's incredibly appreciated
- Daniel Jassy, CFA
Founder of SPYderCrusher Market Research
About - learn about our background and our expertise in quantitative finance
Email: support [at] scmrtrends [dot] com
Quick Disclosure: Nothing in this writeup / demonstration should ever be considered as advice or an invitation to buy or sell any securities. Please see the Terms of Use / Privacy Policy for a full disclaimer.
The CFA Institute does not endorse, promote, or warrant the accuracy or quality of SPYderCrusher Market Research. CFA® and Chartered Financial Analyst® designations are registered trademarks owned by the CFA Institute.
© 2018 — SPYderCrusher Market Research™. All Rights Reserved.
僅限邀請腳本
只有經作者批准的使用者才能訪問此腳本。您需要申請並獲得使用權限。該權限通常在付款後授予。如欲了解更多詳情,請依照以下作者的說明操作,或直接聯絡SPYderCrusher。
除非您完全信任其作者並了解腳本的工作原理,否則TradingView不建議您付費或使用腳本。您也可以在我們的社群腳本中找到免費的開源替代方案。
作者的說明
Imagine yourself objectively analyzing markets, visualizing risk & enhancing the timing of trades.
SCMR Trends™ is TradingView's most popular add-on software for a reason.
--> tradingview.com/market/sc-spydercrusher
Disclaimer: goo.gl/RsfTKX
SCMR Trends™ is TradingView's most popular add-on software for a reason.
--> tradingview.com/market/sc-spydercrusher
Disclaimer: goo.gl/RsfTKX
免責聲明
這些資訊和出版物並不意味著也不構成TradingView提供或認可的金融、投資、交易或其他類型的意見或建議。請在使用條款閱讀更多資訊。