OPEN-SOURCE SCRIPT
Intraday Mean Reversion Money Performance indicator
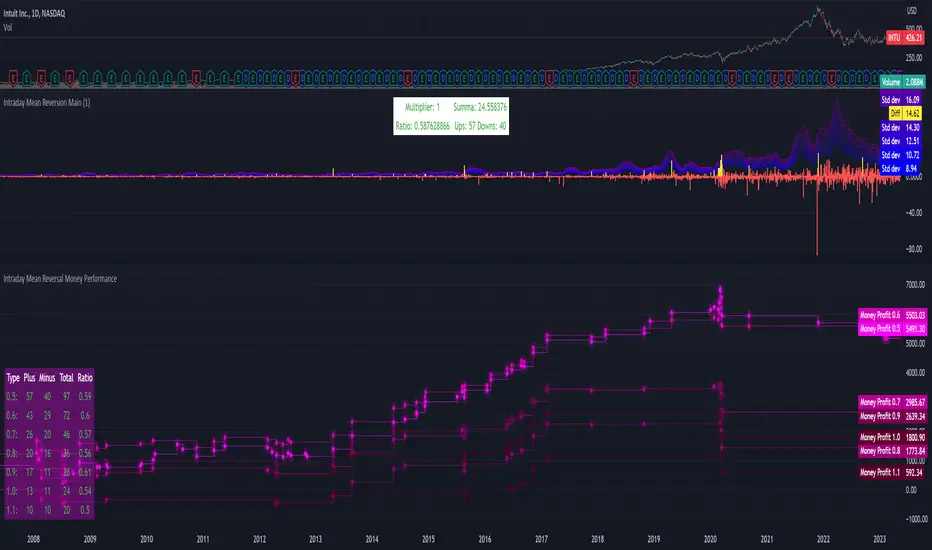
The diagram shows Money Performance when buying stocks for 10 000 at every buy signal from the Intraday Mean Reversion indicator.
The indicator is best used in combination with Intraday Mean Reversion Main Indicator
The rules for trading are: Buy on Open price if the Intraday Mean Reversion Main indicator gives a buy signal. Sell on the daily close price.
According to my knowledge it is not possible to create a PineScript strategy based on these rules, because the indicator is used on Day to Day graph. Therefore this indicator can be used to analyze Money performance of this strategy.
The lines show the performance of the Intraday Mean Reversion Strategy, based on the different levels in the strategy (from 0.5 Standard deviation to 1.1 standard deviation)
Using this indicator it is possible to find stocks that often reverse towards mean after open.
Use this strategy on stocks with high positive performance. Do not use on stocks with negative performance.
開源腳本
本著TradingView的真正精神,此腳本的創建者將其開源,以便交易者可以查看和驗證其功能。向作者致敬!雖然您可以免費使用它,但請記住,重新發佈程式碼必須遵守我們的網站規則。
免責聲明
這些資訊和出版物並不意味著也不構成TradingView提供或認可的金融、投資、交易或其他類型的意見或建議。請在使用條款閱讀更多資訊。
開源腳本
本著TradingView的真正精神,此腳本的創建者將其開源,以便交易者可以查看和驗證其功能。向作者致敬!雖然您可以免費使用它,但請記住,重新發佈程式碼必須遵守我們的網站規則。
免責聲明
這些資訊和出版物並不意味著也不構成TradingView提供或認可的金融、投資、交易或其他類型的意見或建議。請在使用條款閱讀更多資訊。