PROTECTED SOURCE SCRIPT
Litt Heat Map
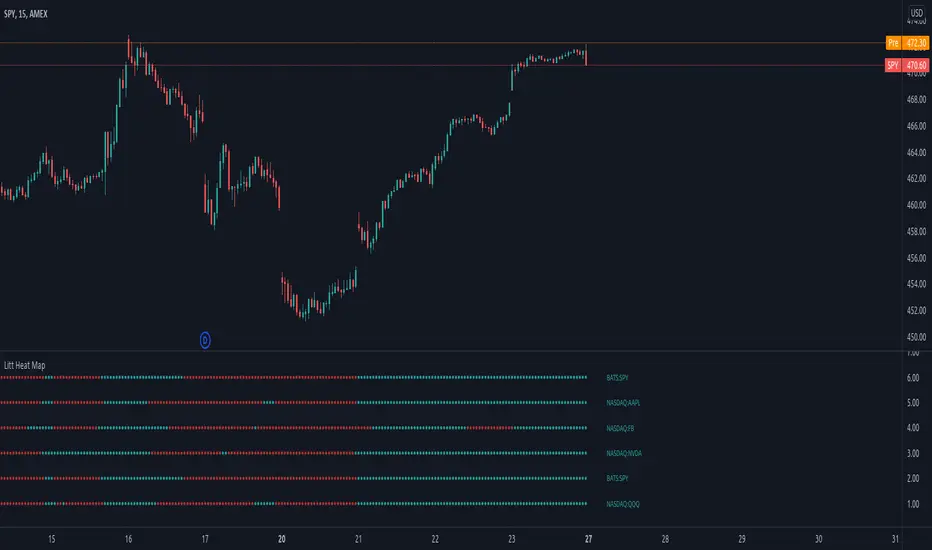
The Litt Heap Map uses the MA Line (Moving Average Line) from Litt Pro Indicators. The Heat Map tells the trader the trend direction based on MA 1 and MA 2.
If the value of MA 1 is greater than the value of MA 2 then the MA Line is colored Bull.
If the value of MA 1 is less than the value of MA 2 then the MA Line is colored Bear.
The Litt Heat Map allows you to see the MA Line for multiple symbols on 1 chart! You can use the Heat Map as a scanner to see when trend has changed, or as a trend confirmation tool when multiple symbols are aligning.
受保護腳本
此腳本以閉源形式發佈。 不過,您可以自由使用,沒有任何限制 — 點擊此處了解更多。
免責聲明
這些資訊和出版物並非旨在提供,也不構成TradingView提供或認可的任何形式的財務、投資、交易或其他類型的建議或推薦。請閱讀使用條款以了解更多資訊。
免責聲明
這些資訊和出版物並非旨在提供,也不構成TradingView提供或認可的任何形式的財務、投資、交易或其他類型的建議或推薦。請閱讀使用條款以了解更多資訊。