PROTECTED SOURCE SCRIPT
RSI + Volume-Weighted TSI
This indicator combines a standard RSI with a modified TSI.
Although a double smoothing process is already used in calculating the normal TSI, we decided to apply a volume weighted moving average of length (length_of_slow_TSI_EMA // 2) to it. This resulted in a smoother TSI that picked up on large-scale swings very nicely.
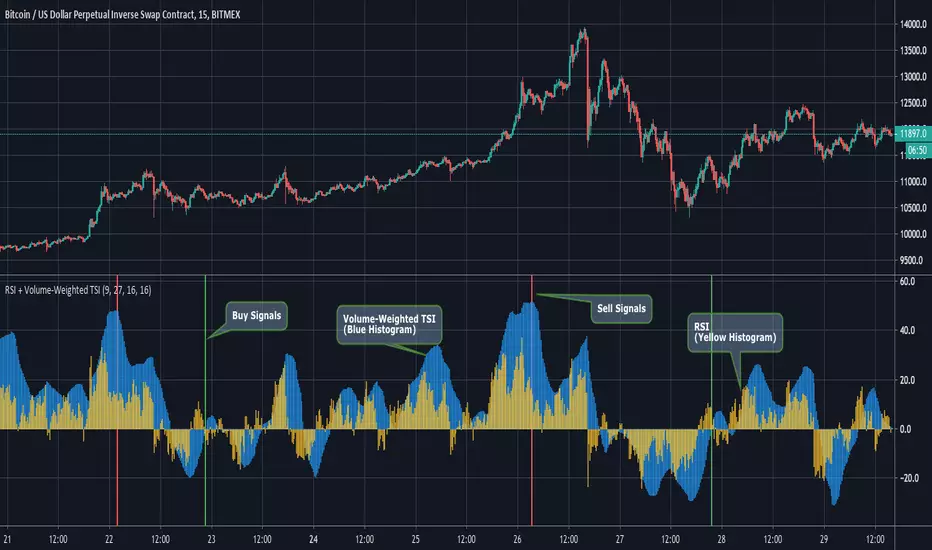
Entry Signals are generated when the Volume-Weighted TSI crosses above zero from negative into positive territory. Exit signals are generated when the TSI is above 40 and then begins its downward fall, along with a declining RSI value.
The Graph:
The Volume-Weighted TSI is plotted as the blue histogram, wile the RSI is plotted as the yellow histogram. We definitely wanted to go the simplicity route on this one's graphics, since the RSI and TSI are both classic and reliable indicators.
The green background highlights indicate an entry signal and red highlights signify an exit signal.
Input Options:
-length of Slow EMA for TSI
-length of Fast EMA for TSI
-Length of Volume Weighted MA of TSI.
-Length of RSI.
~Happy Trading~
Although a double smoothing process is already used in calculating the normal TSI, we decided to apply a volume weighted moving average of length (length_of_slow_TSI_EMA // 2) to it. This resulted in a smoother TSI that picked up on large-scale swings very nicely.
Entry Signals are generated when the Volume-Weighted TSI crosses above zero from negative into positive territory. Exit signals are generated when the TSI is above 40 and then begins its downward fall, along with a declining RSI value.
The Graph:
The Volume-Weighted TSI is plotted as the blue histogram, wile the RSI is plotted as the yellow histogram. We definitely wanted to go the simplicity route on this one's graphics, since the RSI and TSI are both classic and reliable indicators.
The green background highlights indicate an entry signal and red highlights signify an exit signal.
Input Options:
-length of Slow EMA for TSI
-length of Fast EMA for TSI
-Length of Volume Weighted MA of TSI.
-Length of RSI.
~Happy Trading~
受保護腳本
此腳本以閉源形式發佈。 不過,您可以自由使用,沒有任何限制 — 點擊此處了解更多。
-Profit Programmers
profitprogrammer.com
profitprogrammer.com
免責聲明
這些資訊和出版物並非旨在提供,也不構成TradingView提供或認可的任何形式的財務、投資、交易或其他類型的建議或推薦。請閱讀使用條款以了解更多資訊。
受保護腳本
此腳本以閉源形式發佈。 不過,您可以自由使用,沒有任何限制 — 點擊此處了解更多。
-Profit Programmers
profitprogrammer.com
profitprogrammer.com
免責聲明
這些資訊和出版物並非旨在提供,也不構成TradingView提供或認可的任何形式的財務、投資、交易或其他類型的建議或推薦。請閱讀使用條款以了解更多資訊。