INVITE-ONLY SCRIPT
Каналы_SMA_magistratura
⚜️ Custom Indicator "ChannelsSMA_magistratura" — Seeing Trends as Zones, Not Lines
🔹 Why traditional trend lines aren't always practical?
— We draw trend lines, parallels, resistance levels — and the chart turns into a "geometry notebook",
— Every new impulse requires a new channel,
— Old lines get in the way and need to be deleted,
→ This is inefficient, unstructured, and not scalable.
🔹 Alternative — Moving Averages (SMA)
— SMAs show the trend direction without extra drawings,
— We already use SMA Magistratura to see all moving averages across timeframes,
— But we can go even further.
🔹 What are "ChannelsSMA_magistratura"?
— A custom indicator that turns SMA lines into zones,
— Each moving average is surrounded by a channel,
— Channel width is optimized based on backtesting,
→ Shows the normal price range around each SMA.
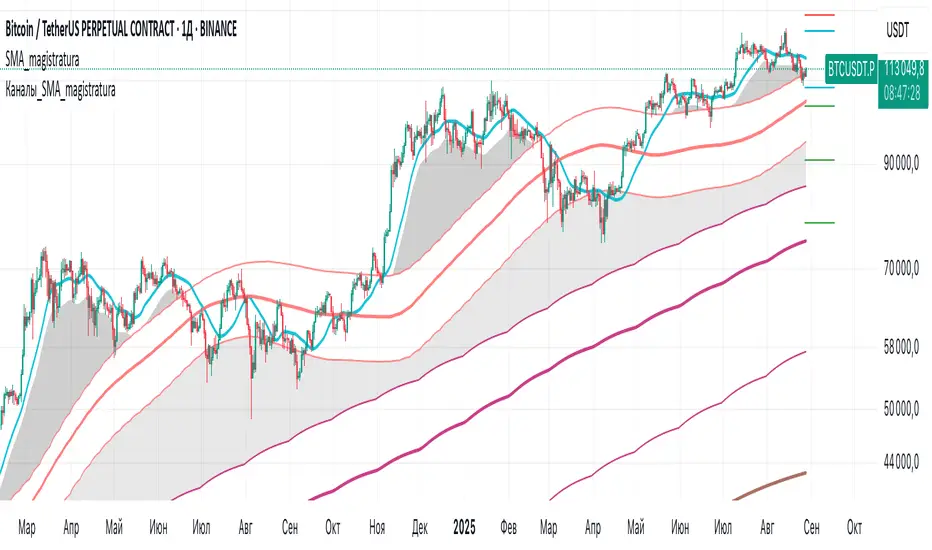
🔹 How the indicator works
— Visually:
SMA — central line,
Channel boundaries — on both sides,
The space between channels — filled in gray.
📌 Gray zones = deviations we call "gaps" (or "breakouts").
🔹 Normal vs. Anomaly
✅ Normal (Equilibrium):
— Price moves within the channel,
— Channels are nested:
→ Daily inside Weekly,
→ Weekly inside Monthly,
→ Monthly inside 3-Monthly.
→ Market is balanced — low volatility, stable trend.
⚠️ Anomaly (Gap):
— Price moves outside the channel,
— Channels diverge, forming a fan:
→ Monthly separates from 3-Monthly,
→ Weekly from Monthly,
→ Daily from Weekly.
→ This signals volatility, potential impulse, or correction.
🔹 Why are gaps the best entry points?
— A gap = anomalous deviation,
— Market is overbought or oversold,
— The wider the gap — the higher the chance of a strong reversal or new impulse.
📌 Example:
— Before a strong rally, price accumulates inside the channel,
— Then — a sharp breakout, piercing multiple levels.
🔹 Why is this indicator separate?
— Not always needed,
— Can be turned on/off for local analysis,
— Keeps the chart clean when using other tools.
🔹 Advantages over manual drawing
— No need to build channels manually,
— No guessing where support/resistance is,
— Everything is visible in advance, visually, and systematically.
"ChannelsSMA_magistratura" is not just an indicator.
It’s a way to see the trend not as a line — but as a zone.
It’s the ability to see not what has already happened,
but what is about to happen.
🔹 Why traditional trend lines aren't always practical?
— We draw trend lines, parallels, resistance levels — and the chart turns into a "geometry notebook",
— Every new impulse requires a new channel,
— Old lines get in the way and need to be deleted,
→ This is inefficient, unstructured, and not scalable.
🔹 Alternative — Moving Averages (SMA)
— SMAs show the trend direction without extra drawings,
— We already use SMA Magistratura to see all moving averages across timeframes,
— But we can go even further.
🔹 What are "ChannelsSMA_magistratura"?
— A custom indicator that turns SMA lines into zones,
— Each moving average is surrounded by a channel,
— Channel width is optimized based on backtesting,
→ Shows the normal price range around each SMA.
🔹 How the indicator works
— Visually:
SMA — central line,
Channel boundaries — on both sides,
The space between channels — filled in gray.
📌 Gray zones = deviations we call "gaps" (or "breakouts").
🔹 Normal vs. Anomaly
✅ Normal (Equilibrium):
— Price moves within the channel,
— Channels are nested:
→ Daily inside Weekly,
→ Weekly inside Monthly,
→ Monthly inside 3-Monthly.
→ Market is balanced — low volatility, stable trend.
⚠️ Anomaly (Gap):
— Price moves outside the channel,
— Channels diverge, forming a fan:
→ Monthly separates from 3-Monthly,
→ Weekly from Monthly,
→ Daily from Weekly.
→ This signals volatility, potential impulse, or correction.
🔹 Why are gaps the best entry points?
— A gap = anomalous deviation,
— Market is overbought or oversold,
— The wider the gap — the higher the chance of a strong reversal or new impulse.
📌 Example:
— Before a strong rally, price accumulates inside the channel,
— Then — a sharp breakout, piercing multiple levels.
🔹 Why is this indicator separate?
— Not always needed,
— Can be turned on/off for local analysis,
— Keeps the chart clean when using other tools.
🔹 Advantages over manual drawing
— No need to build channels manually,
— No guessing where support/resistance is,
— Everything is visible in advance, visually, and systematically.
"ChannelsSMA_magistratura" is not just an indicator.
It’s a way to see the trend not as a line — but as a zone.
It’s the ability to see not what has already happened,
but what is about to happen.
僅限邀請腳本
只有經作者批准的使用者才能訪問此腳本。您需要申請並獲得使用權限。該權限通常在付款後授予。如欲了解更多詳情,請依照以下作者的說明操作,或直接聯絡NZ_27。
除非您完全信任其作者並了解腳本的工作原理,否則TradingView不建議您付費或使用腳本。您也可以在我們的社群腳本中找到免費的開源替代方案。
作者的說明
Индикатор доступен:
+ ученикам Академии трейдинга 2.0
+ ученикам Магистратуры
+ участникам реферальной программы Магистратура (через Bybit, OKX, BingX, Tradingview)
Проект "МАГИСТРАТУРА"
免責聲明
這些資訊和出版物並不意味著也不構成TradingView提供或認可的金融、投資、交易或其他類型的意見或建議。請在使用條款閱讀更多資訊。