OPEN-SOURCE SCRIPT
已更新 Critical Levels by Time Frame

Description
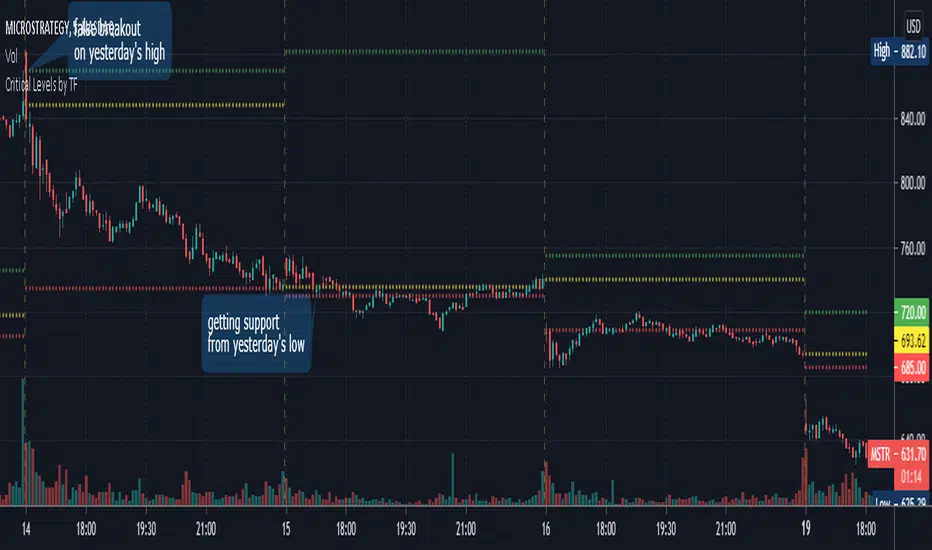
This indicator will help you present critical levels from a certain time frame.
Purpose and Usage
Many day traders are using the previous day high, close and low, as critical levels in their trading. in order to easily present those levels on your chart, I created this indicator in which you can define which of those you would like to present on your chart.
You may choose the best time frame for your needs, I suggest using the daily time frame which is also the default time frame, but you can use the weekly time frame to present the critical levels from the previous week, or you can choose any other time frame you would like.
Pre-market and after-market prices will not be taken into consideration.
Restrict to current DAY
There is an option to present the critical levels only today.
if you’re looking at a wide range of bars and don’t wanna present the critical levels among the entire chart, you may use this restriction to show a cleaner chart.
Filtering critical levels
To present only one or two critical levels (and not all three of them) you may use the style settings. uncheck any critical level that you’re not interested in.
I hope you enjoy this indicator and find it useful,
if you do, please like the script, and feel free to comment below.
Good luck with your trading.
發行說明
Fixed minor bug with last bar開源腳本
秉持TradingView一貫精神,這個腳本的創作者將其設為開源,以便交易者檢視並驗證其功能。向作者致敬!您可以免費使用此腳本,但請注意,重新發佈代碼需遵守我們的社群規範。
免責聲明
這些資訊和出版物並非旨在提供,也不構成TradingView提供或認可的任何形式的財務、投資、交易或其他類型的建議或推薦。請閱讀使用條款以了解更多資訊。
開源腳本
秉持TradingView一貫精神,這個腳本的創作者將其設為開源,以便交易者檢視並驗證其功能。向作者致敬!您可以免費使用此腳本,但請注意,重新發佈代碼需遵守我們的社群規範。
免責聲明
這些資訊和出版物並非旨在提供,也不構成TradingView提供或認可的任何形式的財務、投資、交易或其他類型的建議或推薦。請閱讀使用條款以了解更多資訊。