PROTECTED SOURCE SCRIPT
Simple Market Structure Highs & Lows
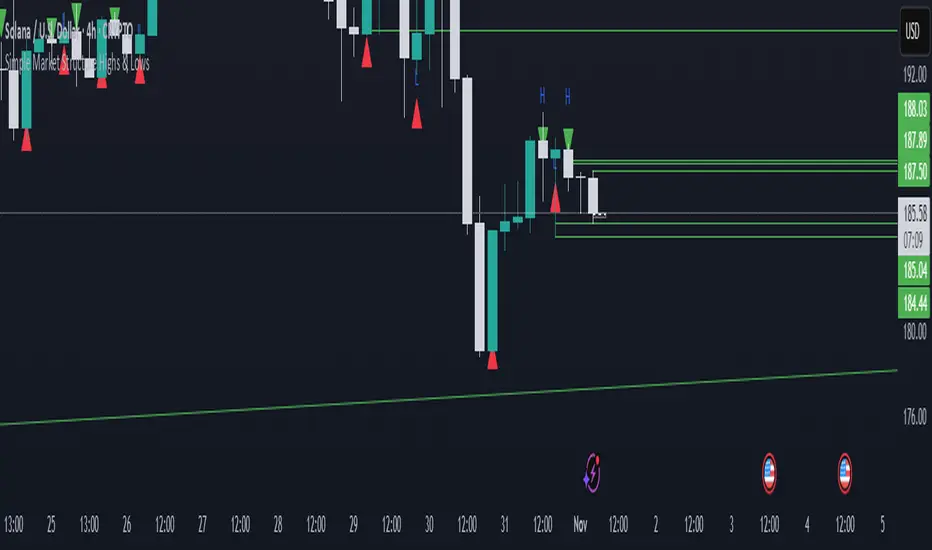
🟩 Simple Market Structure Highs & Lows
This indicator identifies basic swing highs and lows based on simple two-candle patterns, giving traders a clean visual view of short-term market structure shifts.
🔹 Logic
A Swing High (H) is marked when an up candle is followed by a down candle.
→ The high of the up candle (the first one) is plotted as a green triangle above the bar.
A Swing Low (L) is marked when a down candle is followed by an up candle.
→ The low of the down candle (the first one) is plotted as a red triangle below the bar.
🔹 Purpose
This tool helps visualize basic market turning points — useful for:
Spotting local tops and bottoms
Analyzing market structure changes
Identifying potential entry/exit zones
Building the foundation for BOS/CHoCH strategies
🔹 Notes
Works on any timeframe or asset.
No repainting — signals appear after the confirming candle closes.
Simple and lightweight — ideal for traders who prefer clean structure visualization.
受保護腳本
此腳本以閉源形式發佈。 不過,您可以自由使用,沒有任何限制 — 點擊此處了解更多。
免責聲明
這些資訊和出版物並非旨在提供,也不構成TradingView提供或認可的任何形式的財務、投資、交易或其他類型的建議或推薦。請閱讀使用條款以了解更多資訊。
受保護腳本
此腳本以閉源形式發佈。 不過,您可以自由使用,沒有任何限制 — 點擊此處了解更多。
免責聲明
這些資訊和出版物並非旨在提供,也不構成TradingView提供或認可的任何形式的財務、投資、交易或其他類型的建議或推薦。請閱讀使用條款以了解更多資訊。