PROTECTED SOURCE SCRIPT
已更新 Relative Volume with Hull ma and Donchian channel
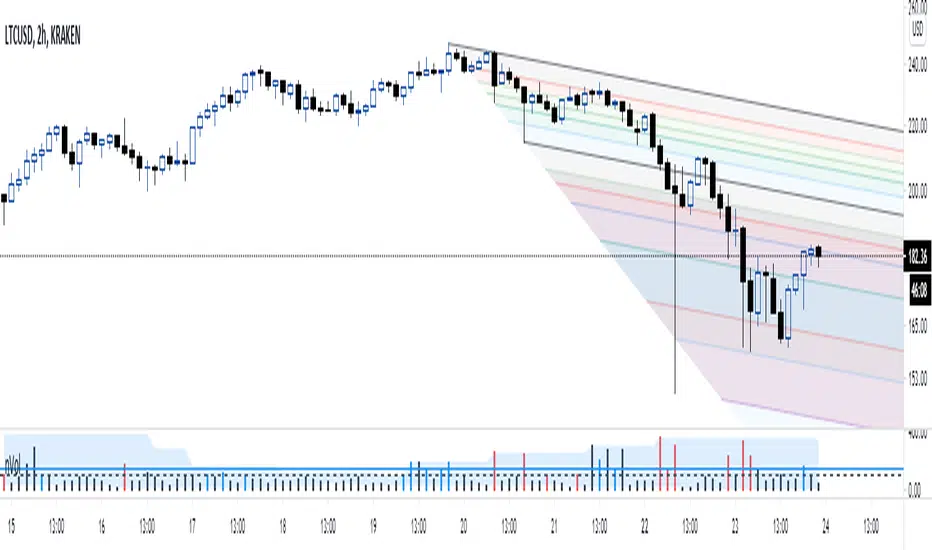
A trader introduced the relative volume to me; I like the concept but its presentation doesn't fit my "visual" taste.
What I did was to color the relative volume bar based on the relationship among (1) hull moving average of the close (2) close vs. open and (3) the relative volume bar reading.
Red -> bearish price action with a lot of volume
Green -> bullish price action with a lot volume
Black -> no clear relationship between volume and price action.
I also added a Donchian channel to the relative volume to further gauge the strength of the relative volume.
All of my posts are for entertainment only.
發行說明
The purpose of this "relative volume" indicator is to easily visualize whether the volume flow supports with a price-action.To further enhance the visualization, I just shifted the main horizontal line using this code.
nVol = volume / Volume_Average * 100 -100
受保護腳本
此腳本以閉源形式發佈。 不過,您可以自由使用,沒有任何限制 — 點擊此處了解更多。
免責聲明
這些資訊和出版物並非旨在提供,也不構成TradingView提供或認可的任何形式的財務、投資、交易或其他類型的建議或推薦。請閱讀使用條款以了解更多資訊。
受保護腳本
此腳本以閉源形式發佈。 不過,您可以自由使用,沒有任何限制 — 點擊此處了解更多。
免責聲明
這些資訊和出版物並非旨在提供,也不構成TradingView提供或認可的任何形式的財務、投資、交易或其他類型的建議或推薦。請閱讀使用條款以了解更多資訊。