OPEN-SOURCE SCRIPT
已更新 Hosoda N Wave and TPs {fmz}

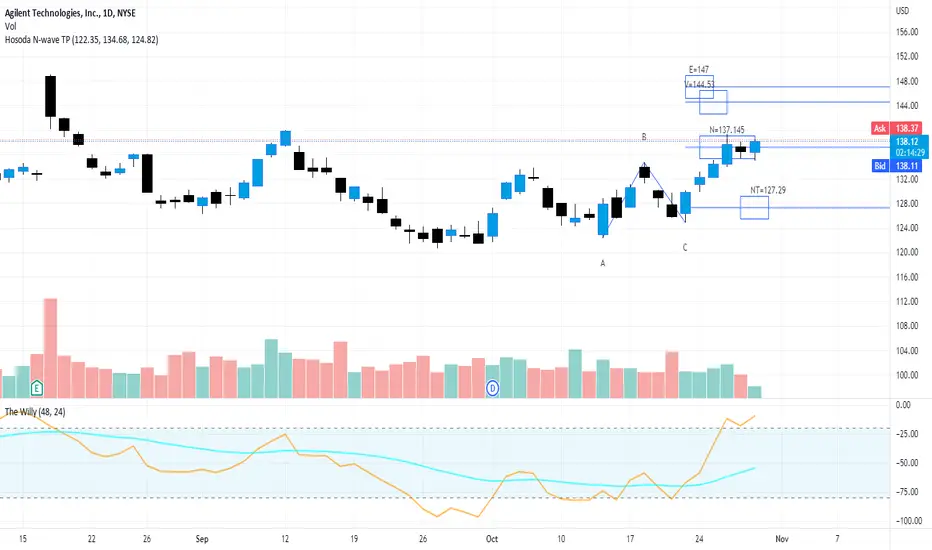
This script allows you to establish in a graphic and interactive way which are the N, NT, V and E targets for a Hosoda N wave.
Apply the indicator to the chart.
The interactive tool of Pine script version 5 will ask you to identify three points of "minimum-maximum-higher minimum" that form a bullish N wave of Hosoda (refer to the specific documentation for Hosoda N wave), or on the contrary three points "maximum-minimum-lower maximum" for a bearish N wave.
Once drawn, the price points can be moved.
When changing the market instrument, the indicator must be removed because it remains linked to the prices where it was first drawn.
發行說明
Thank to all guys that asked me to improve this script adding the time part of the theory.This new version allows from the moment in which the selected points ABC of the N wave are plotted to estimate where the objectives will be reached according to the Hosoda theory both in price and in time.
For the details of the calculation, see the references relating to the Nosoda N wave.
To use it you need to add it to the chart, the chart will ask you to choose three points (minimum-maximum minimum greater for a bullish trend, or maximum-minimum-maximum lower for a bearish trend) from which it will derive the possible targets for Hosoda.
Please check if it works well and report me in the comments if there are any problems, describing in detail the environment in which you are trying it in case you want to make reports.
發行說明
Restored lines on target with boolean to hide and show them發行說明
Conditional hide of Tp E date-time if BC>AC, the time target will be before point C. I'm curious about timing rule for choosing ABC point in Hosoda books, Anyone knows? Maybe we ave a AB time smaller than BC? So E target timing will be before C? 發行說明
Allows to create a grid on time and price targets. Allows to trim horizontal lines to limit chart cluttering.開源腳本
秉持TradingView一貫精神,這個腳本的創作者將其設為開源,以便交易者檢視並驗證其功能。向作者致敬!您可以免費使用此腳本,但請注意,重新發佈代碼需遵守我們的社群規範。
免責聲明
這些資訊和出版物並非旨在提供,也不構成TradingView提供或認可的任何形式的財務、投資、交易或其他類型的建議或推薦。請閱讀使用條款以了解更多資訊。
開源腳本
秉持TradingView一貫精神,這個腳本的創作者將其設為開源,以便交易者檢視並驗證其功能。向作者致敬!您可以免費使用此腳本,但請注意,重新發佈代碼需遵守我們的社群規範。
免責聲明
這些資訊和出版物並非旨在提供,也不構成TradingView提供或認可的任何形式的財務、投資、交易或其他類型的建議或推薦。請閱讀使用條款以了解更多資訊。